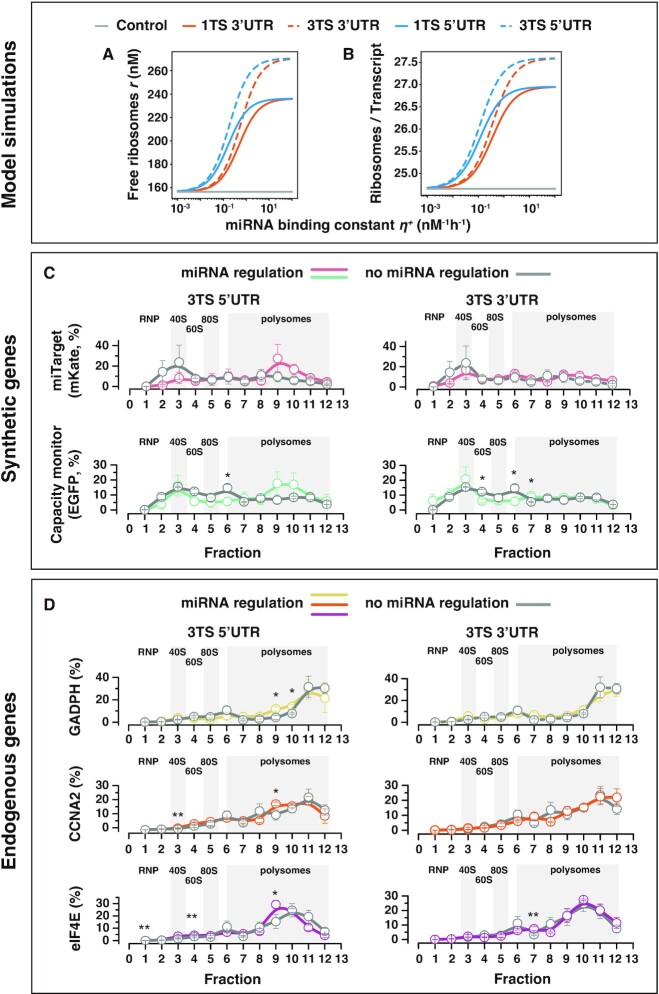
Figure 3.
Ribosomes redistribution. (A) Predicted steady-state concentration levels of the free ribosomes varying the miRNA binding constant  in different design conditions. (B) Predicted steady-state ribosomal densities (Materials and Methods) for both the miTarget and capacity monitor genes varying the miRNA binding constant
  in different design conditions. Design conditions include different location and number of the miRNA target sites within the UTRs of the miTarget gene. The miRNA binding constant
  is considered as an independent variable and thus is not set to a fixed value. Instead, the values considered for
  span a range of reasonable characteristic values. An increase in the miRNA binding constant
  is correlated to an increase in the pool of free ribosomes and the ribosomal densities, and supports the hypothesis of ribosomes reallocation upon miRNA-driven regulation. (C, D) Relative distribution of transcripts and co-sedimentation analysis in polysomes profiles in H1299 cells transfected with a bidirectional promoter plasmid encoding for EGFP (capacity monitor) and mKate (miTarget) with miR-31 TS either at the 5’ or 3’ UTR. As control, we used the same plasmid lacking the miR-31 target sites. We analysed both synthetic (C) and endogenous (D) genes. Polysome profiles were obtained 48 hours post transfection. Means of the relative percentage of transcript sedimentation along the profile ± SE. SE: standard errors are shown. N = 3 biological replicates. Unpaired two-sided t-test. P-value: * < 0.05, ** < 0.005.

