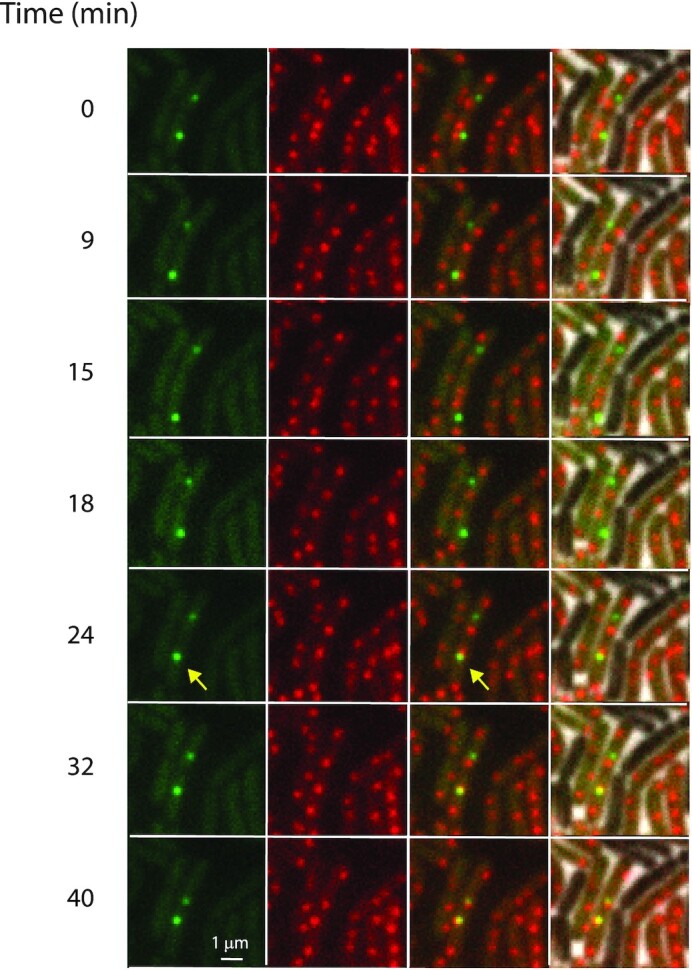
Figure 1.

Search for the chromosomal integration site attB by ICEBs1. First column: snapshots of ICEBs1 labelled with GFP in transconjugant cells at the indicated times (green dots), ∼1 h after mating of MMB1277 as a donor and SAM318 as a recipient (Materials and Methods), with  corresponding to the time at which the first image was recorded; second column: attB labelled with mApple2 (red dots); third column: overlay of GFP (ICEBs1) and mApple2 (attB) images; fourth column: overlay of third column with phase contrast images, showing the presence of non-fluorescent donor cells. Arrows show a moving ICEBs1 that integrates (see also Movie S1). The scale bar represents 1 μm.
