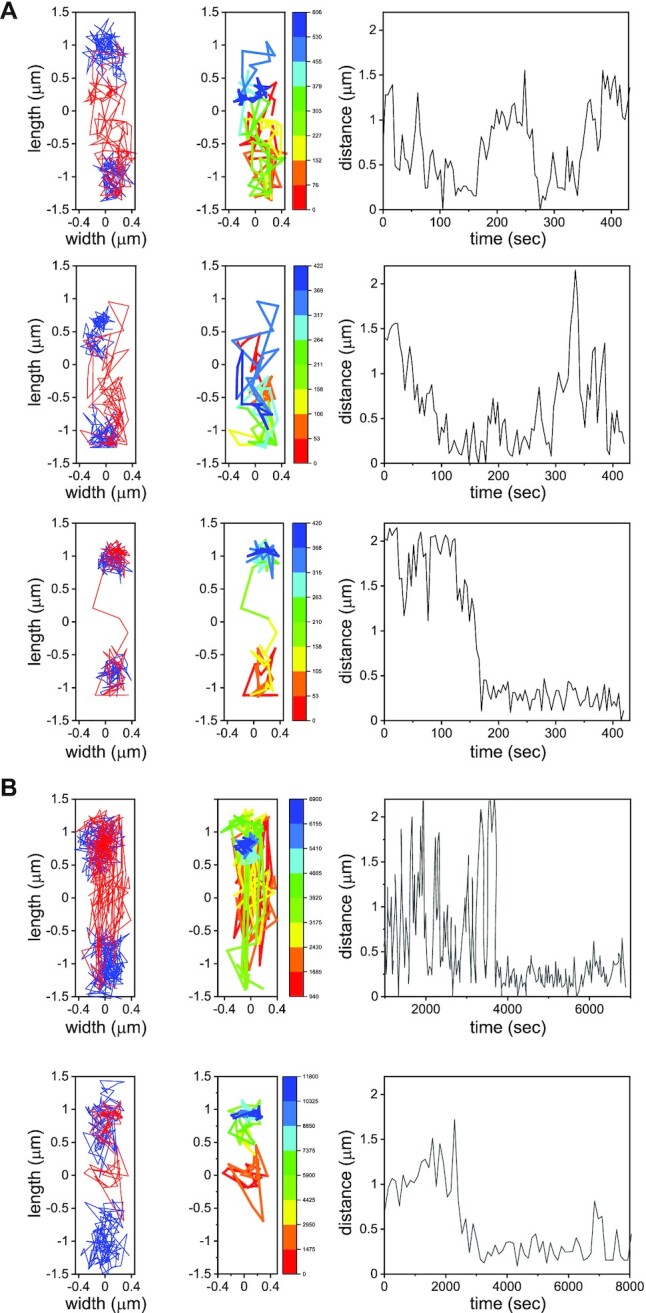
Figure 3.

Target search for attB by ICEBs1. (A) First panels from left to right: Representative two-dimensional trajectories of attB (blue) and ICEBs1 (red) in three transconjugants; the interval between successive positions in the trajectories is ∼4 s. Second panel: ICEBs1 trajectories color-coded according to time. Third panel: distance between ICEBs1 and one of the attB sites (there are two because most cells have a partly replicated chromosome). (B) As in (A), for typical intervals of ∼120 s between frames.
