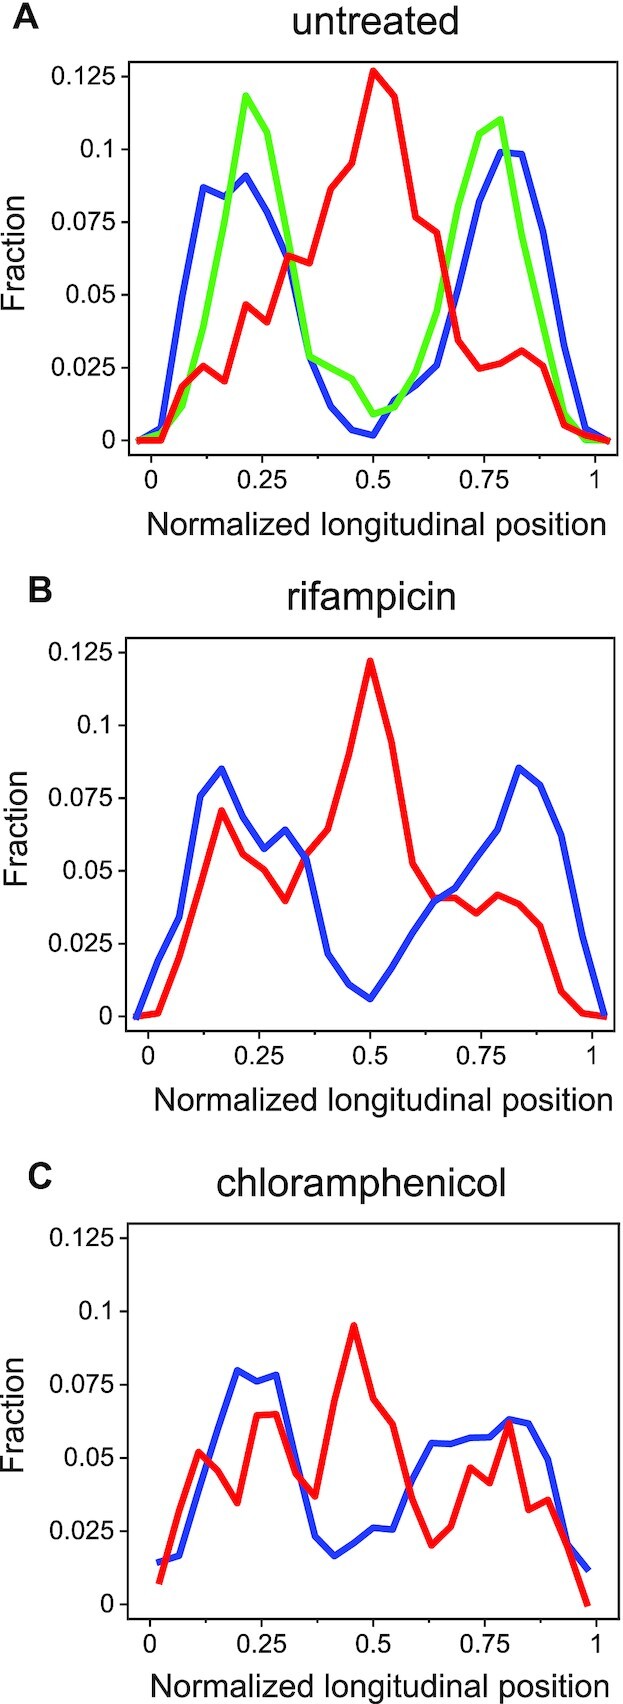
Figure 4.

Position distributions of chromosomal loci and ICEBs1 along the cell's main axis. (A) Distributions of normalized longitudinal positions of a tet array in yddS (∼47°; 13.16 centisomes) near attB (blue, ∼45°; 12.56 centisomes, n = 8040), Supplementary Figure S1) and a tet array in a different chromosomal locus (green, 300°, using SAM049, n = 10 560), and ICEBs1 (red, n = 1134) along a cell's main axis. Only ICEBs1 trajectories whose displacements were >200 nm were included. Longitudinal positions were normalized by the cell length. (B) Same as in (A), but for cells following treatment with rifampicin (red n = 933 and blue n = 3196). (C) Same as in A, but for cells following treatment with chloramphenicol (red n = 7646 and blue n = 5270).
