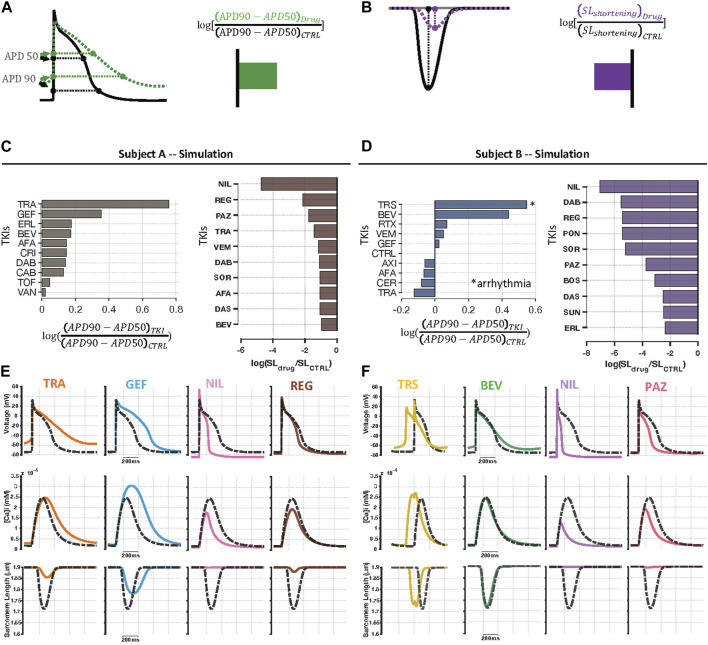
FIGURE 2.
Individual specific predictions of physiological alterations caused by TKIs. (A) To examine TKI-induced effects on electrophysiology, we computed triangulation of AP waveforms from the simulation output for each drug. In the diagram, the green curve, representing drug-induced changes, shows a more triangular waveform than the black curve, representing the baseline model, which indicates an increase in triangulation. (B) TKI-induced contractile dysfunction was evaluated using sarcomere length shortening simulation results. Because the drug-treated purple curve exhibits reduced shortening compared with the black (control) curve, this change is summarized as a decrease in contraction strength. (C, D) Individual specific, top 10 rankings for log-transformed AP triangulation and contractile failure metrics. Amongst the top 10 most highly-ranked TKIs, there was higher level of correlation between subject A and B in contractile dysfunction (Spearman’s rank correlation, ρ = 0.64, p = 0.054) than AP triangulation rankings (ρ = -0.16, p = 0.65). (E, F) Example AP, CaT, and SL shortening simulation results in the two cell lines showing examples of drug-induced AP triangulation and contractile failure. Dashed black curves represent untreated cells, and colored lines represent predictions for, from left to right, trametinib, gefitinib, nilotinib, and regorafenib in Cell Line A, and trastuzumab, bevacizumab, nilotinib, and pazopanib in Cell Line B.

