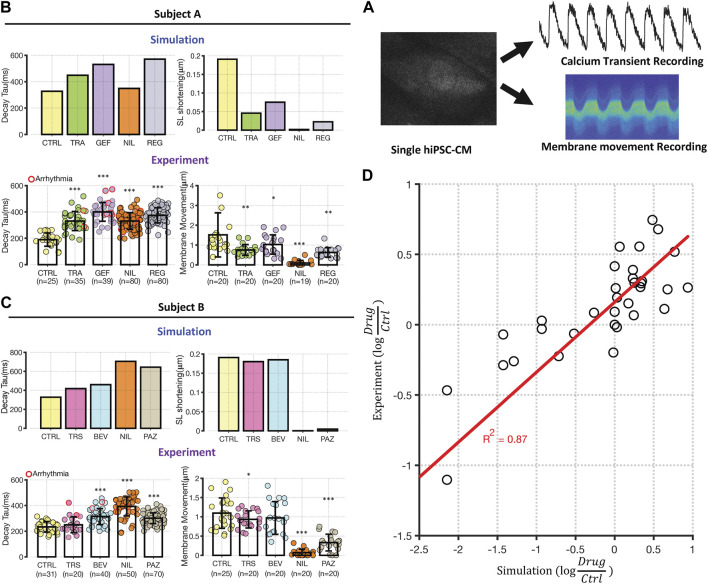
FIGURE 3.
Experimental testing of transcriptomic based simulation predictions. (A) Schematic illustrating that iPSC-CMs were loaded with either fluo3 or FluoVolt for CaT or membrane movement recordings, respectively. Metrics were extracted from fluorescence time course measurements for comparison with simulation results. (B, C) Comparison between simulations of Decay Tau (left bar graphs) and SL shortening (right bar graphs) in the two cell lines. Simulation results for control conditions and four drugs in each cell line are shown above experimental results under the same conditions. Results from Cell Lines A and B are displayed in panels (B) and (C), respectively. Error bars indicate standard deviation, and asterisks indicate significantly different from control, based on two sample, unpaired t-test (*p < 0.05, **p < 0.01 and ***p < 0.001). The number of experimental samples in each group is provided beneath the experimental bar graphs. (D) Direct comparison of modeling predictions (abscissa) with experimental data (ordinate), with each expressed as the logarithm of the change in drug-treated relative to vehicle-treated iPSC-CMs. Each dot represents a change in a time course metric (Decay Tau, CaT triangulation, CaT AUC, and SL shortening) caused by changes in gene expression induced by a particular drugs. Results from Cell Lines A and B are grouped together, and the calculated R2 of 0.87 includes 3 data points that induce extreme changes to metrics and are not visible on this scale.

