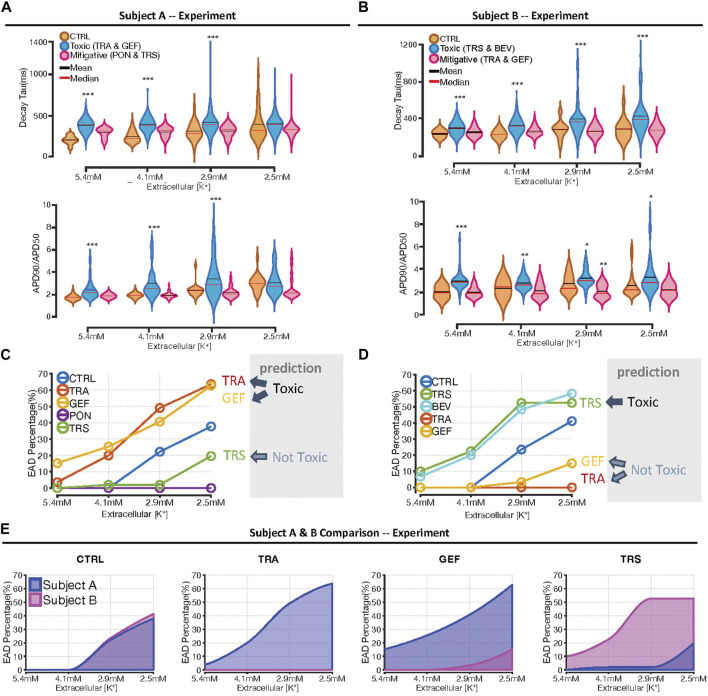
FIGURE 5.
Summary data indicating differential response to hypokalemia between cell lines. (A, B) Violin plots indicating the distributions of Decay Tau (top plots), and AP triangulation (bottom plots), as a function of extracellular [K+], in Cell Lines A and B, respectively. To facilitate statistical comparisons, drug treatments are grouped as either “toxic” drugs or “mitigative” drugs predicted to increase or decrease susceptibility, respectively. Asterisks indicate conditions statistically different from vehicle-treated control cells at the same level of extracellular [K+], using a two sample, unpaired t-test (*p < 0.05, **p < 0.01 and ***p < 0.001). (C, D) Percentage of samples exhibiting arrhythmic dynamics, as a function of extracellular [K+], in Cell Lines A and B, respectively. Drugs predicted to be toxic, namely, trametinib and gefitinib in Cell Line A, and trastuzumab and bevacizumab in Cell Line B, exhibited an increase in arrhythmia percentage at all levels of extracellular [K+]. (E) Comparison of arrhythmia percentage between cell lines, as a function of [K+], under different conditions. The numbers of cells and cover slips under each condition are provided in Supplementary Table S1.

