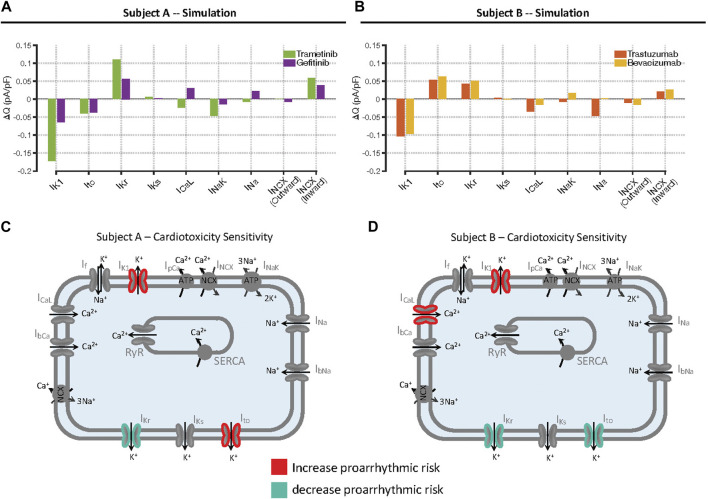
FIGURE 6.
Mechanisms underlying increased arrhythmia susceptibility caused by individual drugs in the two cell lines. (A, B) Calculations of changes in total charge, ΔQ, passing through individual ionic currents, in Cell Lines A and B, respectively. Simulations were performed at the level of extracellular [K+] immediately before arrhythmias occurred in drug-treated cells, and the integral of each current during the action potential was computed. Bars represent the difference in integrated current, or charge (Q), between drug-treated and untreated cells. (C, D) Summary of changes in ionic currents that accounted for increased susceptibility in the two cell lines. Each panel shows the changes in ionic currents that act to increase arrhythmia risk in red, contrasted with the changes that act to decrease arrhythmia risk in blue.

