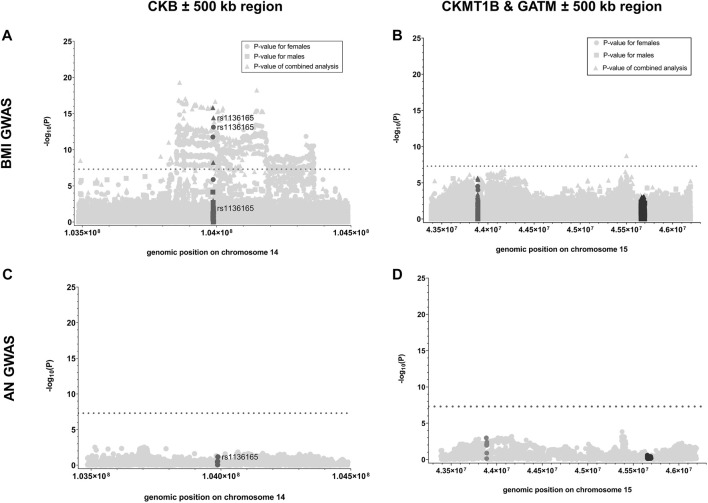
FIGURE 2.
p-values of SNPs analyzed in GWAS for BMI or AN located within the genes of interest and their adjacent regions. Here, the negative logarithmic p-values extracted from the sex-stratified BMI GWAS [Pulit et al., 2019; (A, B)] and the GWAS for AN (Watson et al., 2019; (C, D) are plotted against the genomic positions of the SNPs located within CKB (A, C); dark gray), CKMT1B [(B, D); dark gray] and GATM [(B, D); black] as well as their 500 kb adjacent regions (light gray; GRCh37; see Table 1; Supplementary Table S2). For the data regarding the sex-stratified BMI GWAS, the negative logarithmic p-values are presented for the female (dot), male (square), and combined (triangle) analyses. The threshold for genome-wide significance is indicated by the dotted lines (-log10(p) > 7.3).

