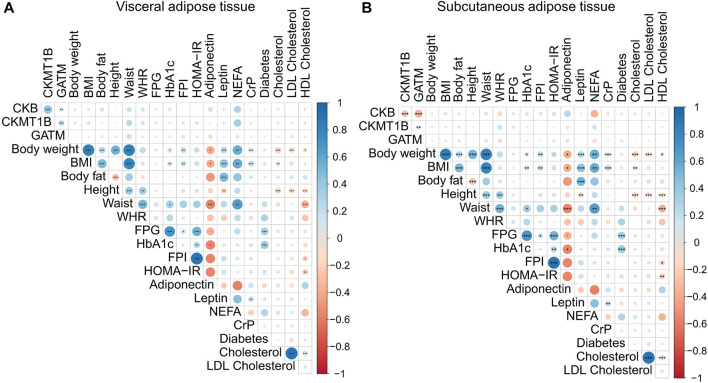
FIGURE 4.
Correlations of CKB, CKMT1B, and GATM with clinical parameters. The presented data are based on RNA-sequencing data of omental visceral (A) and abdominal subcutaneous (B) adipose tissues from 1,479 individuals of the LOBB. The correlations were calculated with Pearson’s correlation coefficient. p-values were adjusted for multiple comparisons using Hommel’s method (Hommel, 1988). Positive correlations are shown in blue, while negative correlations are represented in red. The size of the dot refers to the degree of correlation. Significance; padj. < 0.001 (***), padj. < 0.01 (**), and padj. < 0.05 (*). BMI: body mass index. CrP: c-reactive protein. FPI: fasting plasma insulin. FPG: fasting plasma glucose. HbA1C: hemoglobin A1C. HDL: high-density lipoprotein. HOMA-IR: homeostatic model assessment for insulin resistance. LDL: low-density lipoprotein. NEFA: non-esterified fatty acids. WHR: waist-to-hip ratio.

