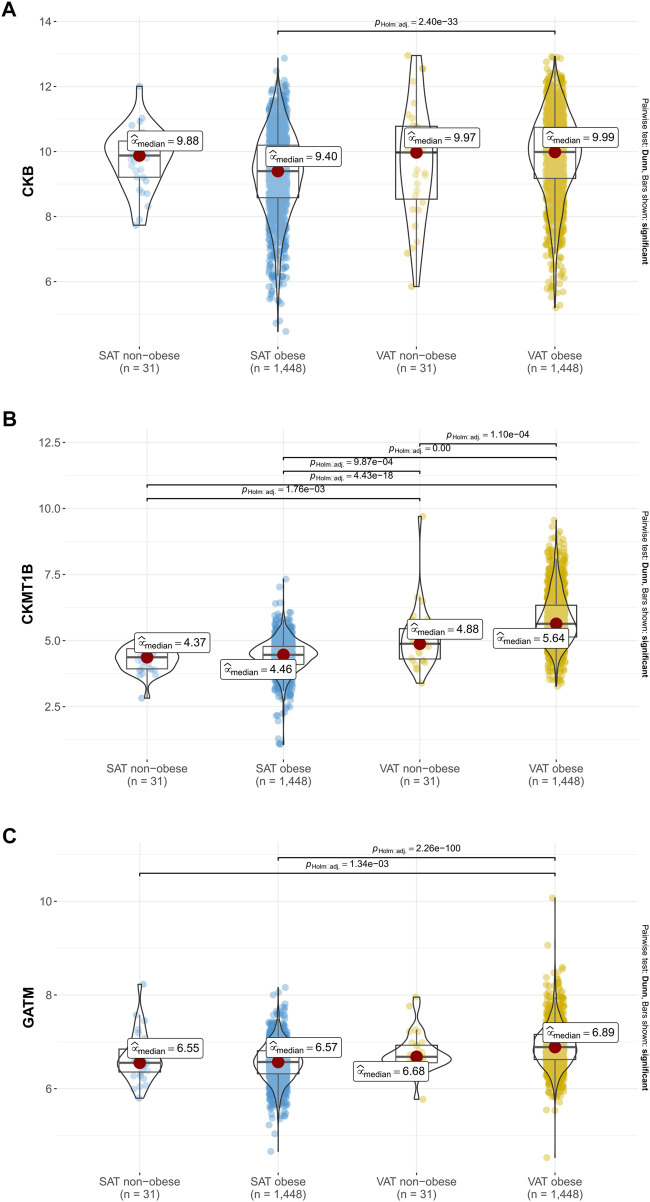
FIGURE 5.
Gene expression of CKB, CKMT1B and GATM in probands with and without obesity. Expression data of CKB (A), CKMT1B (B) and GATM (C) are based on 1,479 probands with and without obesity from the LOBB. As the data were not normally distributed in all instances, non-parametric Kruskal–Wallis one-way ANOVAs were performed to check whether the location parameters of the distributions were the same in each group. The corresponding effect size was calculated as epsilon square, while pairwise comparisons were performed with Dunn’s test. p-values were adjusted based on Hommel’s method (Hommel, 1988). SAT: subcutaneous adipose tissue. VAT: visceral adipose tissue.

