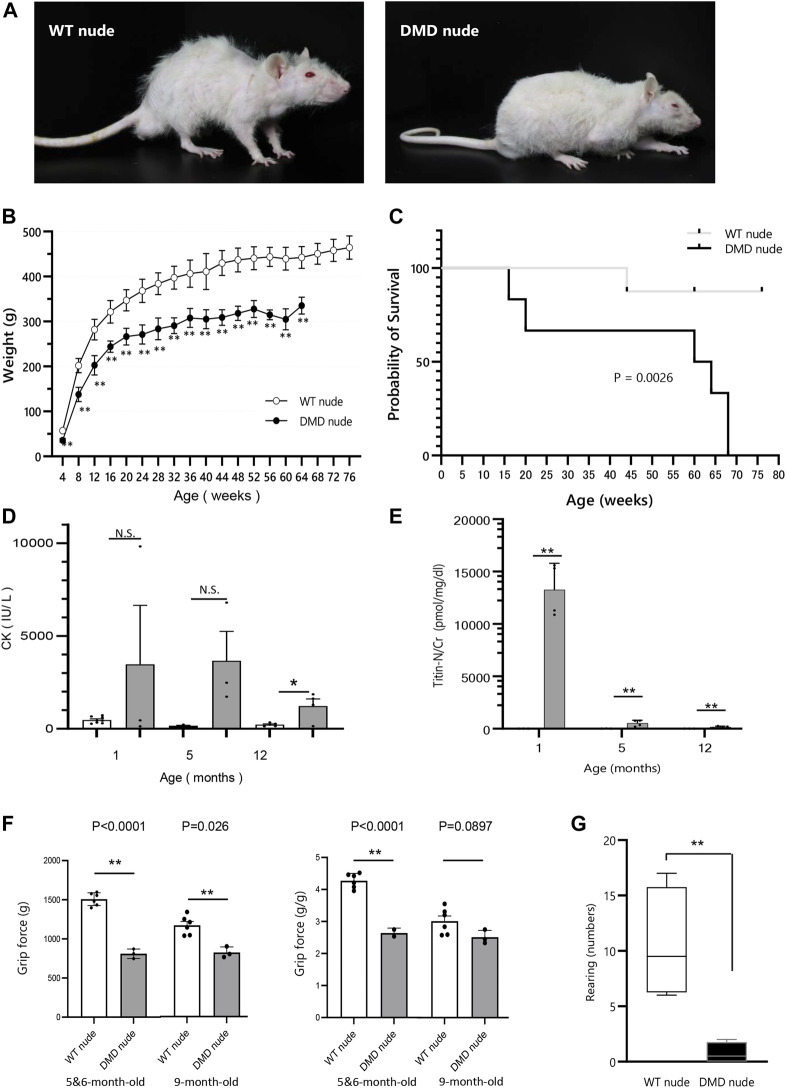
FIGURE 1.
Generation of immunodeficient Duchenne muscular dystrophy (DMD) rat model. (A) Representative images of 12-month-old wild type (WT) and DMD nude rats. (B) Body weight comparison of WT and DMD nude rats. (WT nude rat: n = 8, DMD nude rat: n = 7). (C) Kaplan-Meier curves comparing survival rates of WT and DMD nude rats. Mantel-Cox test, p = 0.0026. (WT nude rat: n = 8, DMD nude rat: n = 7). (D) The serum creatine kinase (CK) activity in WT and DMD nude rats (WT nude rats: n = 8, 3, and 5; DMD nude rat: n = 3, 3, and 3). (E) The urinary titin concentrations in WT and DMD nude rats (WT nude rats: n = 3 for all groups; DMD nude rat: n = 4 for all groups). (F) Quantification of maximum muscle strength by grip test. The study was conducted on 5 to 6 and 9-month-old WT nude and DMD nude rats. (WT nude rat: n = 2, 2, DMD nude rat: n = 1, 1). (G) Motor behavior was examined using an open-field test. WT and DMD nude rats at 12-month-old were individually placed in the cylinder for 3 min (WT nude rat: n = 4, DMD nude rat: n = 4). *p < 0.05, **p < 0.01.

