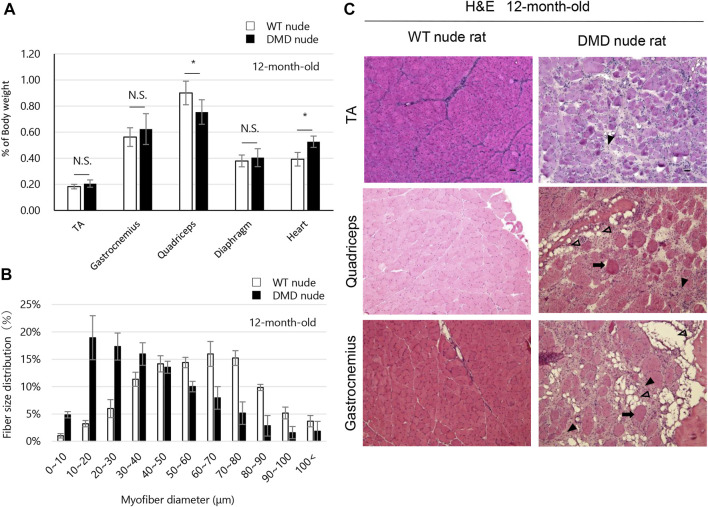
FIGURE 2.
Phenotypic analysis of the skeletal muscles of DMD nude rats. (A) The percentage of body weight represented by each muscle tissue at the indicated ages in WT and DMD nude rats. N.S. non-significant, *p < 0.05. (B) Histological changes in the fiber diameter in 12-month-old WT and DMD nude rats. (C) Representative images of hematoxylin & eosin (H&E) staining of the tibialis anterior (TA), quadriceps, and gastrocnemius muscle sections in 12-month-old WT and DMD nude rats. The symbols, ➡, ▼, and ▽, indicate necrotic myofibers, fibrosis, and adipogenesis, respectively. Scale bar = 50 µm.

