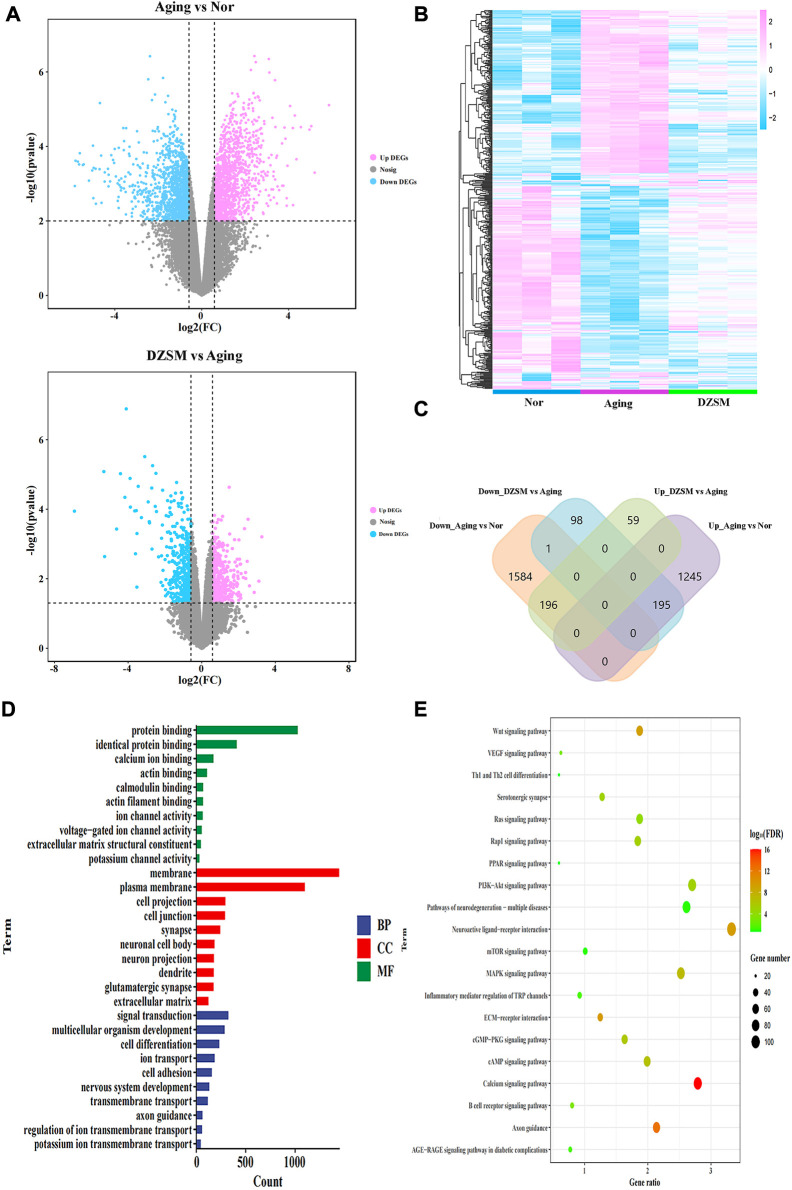
FIGURE 3.
Transcriptomics analysis. (A) Volcano map of the DEGs in the Aging vs. Normal (Nor) groups and the DZSM vs. Aging groups; (B) Heatmap of the DEGs in the Nor, Aging, and DZSM groups; (C) Venn diagram of the DEGs in the Nor, Aging, and DZSM groups; (D) GO enrichment analysis of DEGs (red terms represent MF, green terms represent CC, and blue terms represent BP). (E) KEGG pathway analysis of DEGs.

