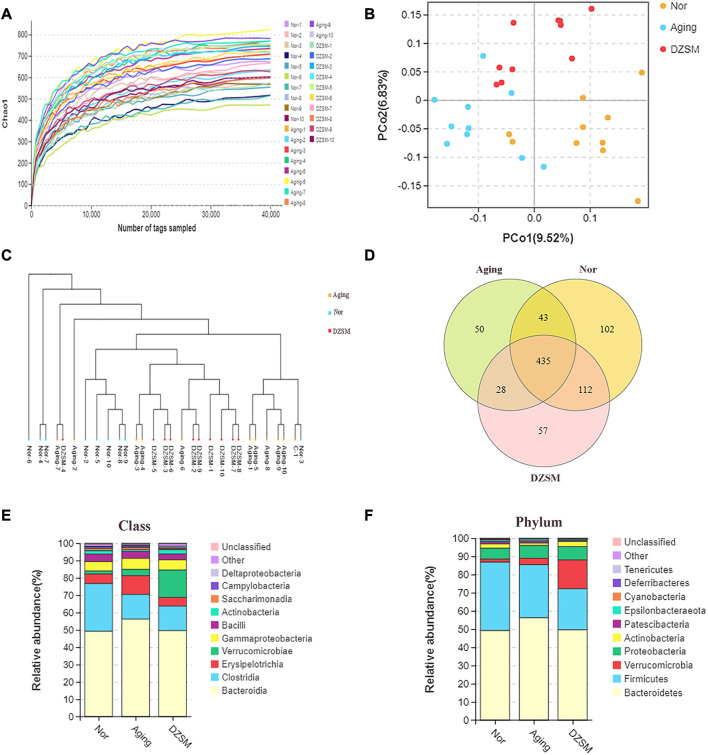
FIGURE 6.
The intestinal microbiome determined by 16S rDNA. (A) Rarefaction curve of the chao1 index; (B) Unweighted UniFrac PCoA in which each dot represents the gut microbiota of a mouse; (C) Unweighted pair group method with arithmetic mean (UPGMA) sample clustering tree; (D) Venn diagram of three groups indicates shared and special OTUs of Nor, Aging, and DZSM groups; (E,F) Intestinal microbial taxonomic composition of DZSM at the class and phylum levels.

