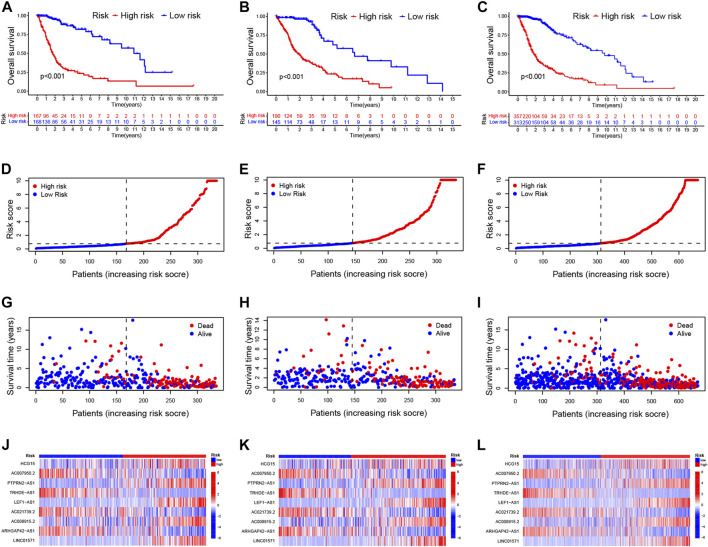
FIGURE 2.
Validation of the prognostic signature of CRLs (A–C). Kaplan–Meier curves for OS in the training sets (A), testing sets (B), and entire set (C) (D–F). Distribution of the CRL-model-based risk score for the training sets (D), testing sets (E), and entire set (F) (G–I). Patterns of survival time and survival status ranked by risk score in the training sets (G), testing sets (H), and entire set (I) (J–L). Heatmap showing the display levels of the ten lncRNA for each patient in the training sets (J), testing sets (K), and entire set (L). CRL, cuproptosis related lncRNA; OS, overall survival.

