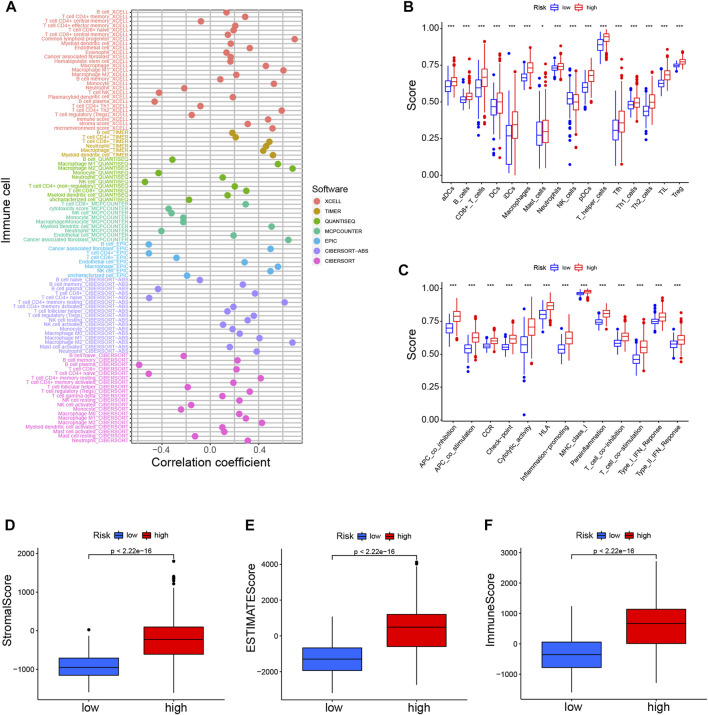
FIGURE 6.
Immune landscapes of CRLs prognostic signature (A). Heatmap for immune infiltration among high- and low-risk groups based on xCELL, TIMER, quanTIseq, MCP-counter, EPIC, CIBERSORT-ABS, and CIBERSORT algorithms (B). SsGSEA analysis showing the extent of immune cell infiltrations in the high- and low-risk groups (C). SsGSEA analysis displaying the functions of immune cell subpopulations between high-risk and low-risk groups (D–F). Stromal score, ESTIMATE score, and immune score in the high- and low-risk groups. *p < 0.05, **p < 0.01, ***p < 0.001. SsGSEA, single-sample gene set enrichment analysis.

