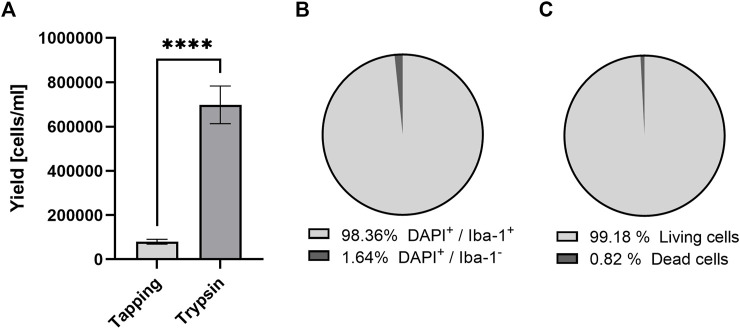
FIGURE 1.
Purity and vitality of microglia based on two different isolation methods irrespective of genotype. Comparison of microglia yield from tapping and two-step mild trypsinization: (A) The total number of cells, (B) the proportion of microglia and (C) vital cells after 14 days of culturing after microglia enrichment. Data are expressed as mean ± S.E.M, T-test with Welch correction; tapping: n = 33, mild trypsinization: n = 25; n = 10 ROIs.

