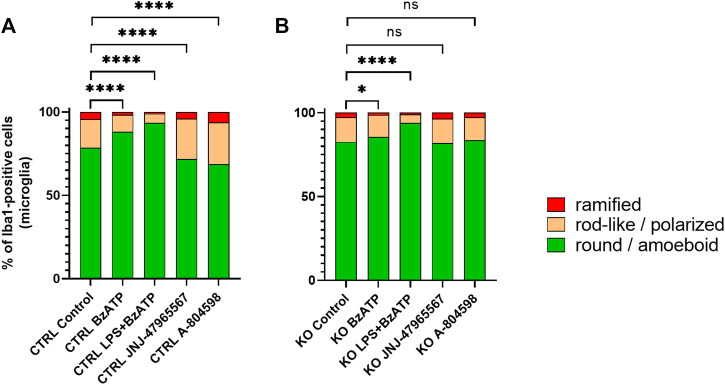
FIGURE 4.
Manual morphotyping of microglial phenotype. Within-group comparison of (A) CTRL and (B) KO microglia morphology proportion changes between the baseline and after hP2X7R-targeting treatments (i.e., BzATP, LPS + BzATP, JNJ-47965567, A-804598). Data are expressed as % of total Iba1-positive cells per genotype and treatment condition including the untreated genotype controls. Chi2 Test for the proportion of [round/ameboid] vs. [polarized + ramified microglia] between the CTRL or KO group’s untreated control wells and the respective treatment conditions, *p < 0.05, **p < 0.01, ***p < 0.001, and ****p < 0.0001, n = 8–11 mice with 952–3,428 cell per group (except: A-804598 in CTRL groups, n = 5 mice and 933 cells).

