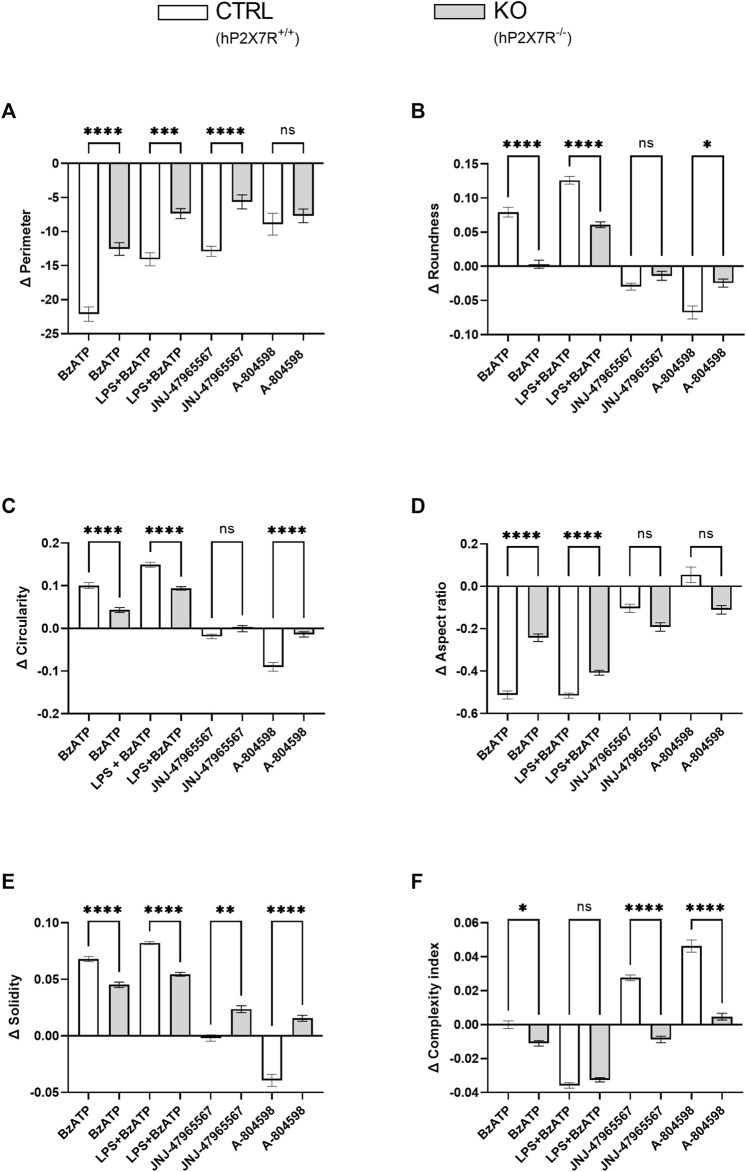
FIGURE 5.
Microglia shape descriptors after hP2X7R-targeting treatments (i.e., BzATP, LPS + BzATP, JNJ-47965567, A-804598). Graphs show between-genotype and treatment comparisons of (A) cell perimeter, (B,C) roundness and circularity, (D) aspect ratio, (E) solidity, and (F) the complexity index. Shape descriptor values were corrected per group by the respective untreated within-genotype control well means. The hP2X7R-proficient group (CTRL) is displayed in white, the hP2X7R-knockout group (KO) is shown is grey. Data are expressed as mean + S.E.M, KW with Dunn’s test, *p < 0.05, **p < 0.01, ***p < 0.001, and ****p < 0.0001, n = 8–11 mice per group (except: A-804598 in CTRL group, n = 5 mice). Cells per group (CTRL A-804598): perimeter = 831–2,131 (666); roundness = 815–2039 (645); circularity = 836–2,132 (666); aspect ratio = 785–1997 (616); solidity = 777–2072 (657); complexity = 800–2093 (651).

