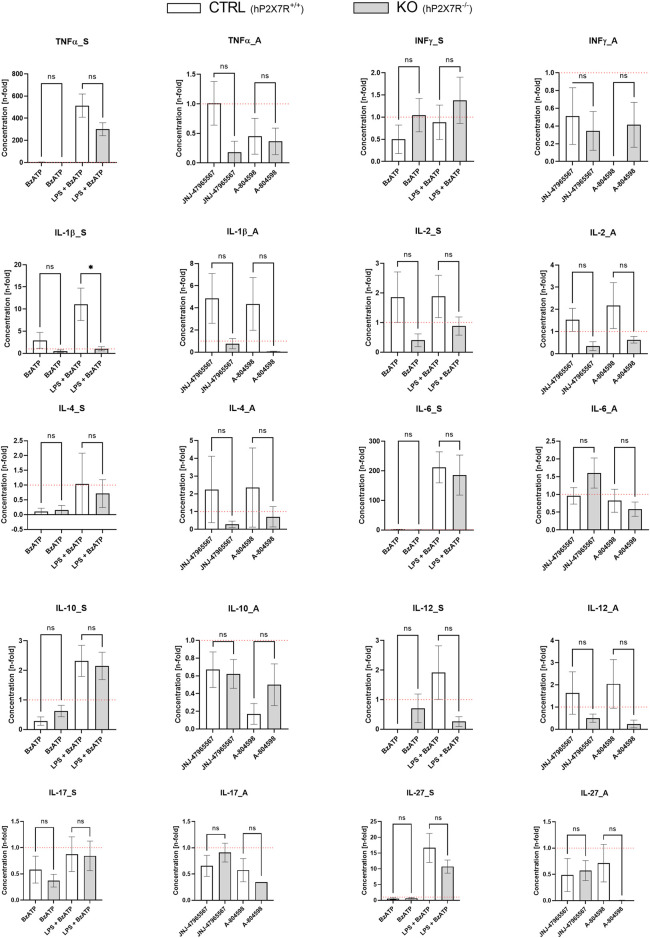
FIGURE 6.
Cytokine secretion alterations following the different hP2X7R-targeting treatments (i.e., BzATP, LPS + BzATP, JNJ-47965567, A-804598). Graphs show the n-fold changes measured in cell culture supernatant of CTRL and KO microglia cultures side by side. For each of the ten cytokines (TNFα, INF-γ, IL-1β, IL-2, IL-4, IL-6, IL-10, IL-12, IL-17/IL-17A, IL-27), a stimulation (_S) and an antagonism (_A) graph is shown. All cytokine levels were first corrected by the untreated within-genotype control well means and n-fold changes were then calculated per group and treatment condition. The hP2X7R-proficient group (CTRL) is displayed in white the hP2X7R-knockout group (KO) is shown is grey. Comparisons were performed between the two genotypes for each of the treatments. Data are expressed as mean + S.E.M, T-test with Welch correction, *p < 0.05, **p < 0.01, ***p < 0.001, and ****p < 0.0001, n = 5–7 mice per group.

