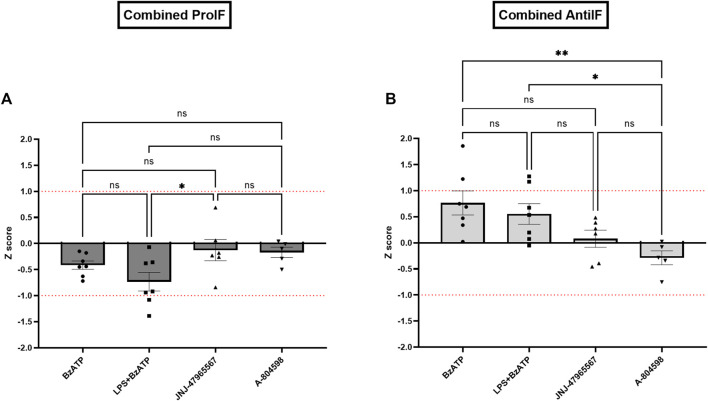
FIGURE 8.
Combined Z scores of (A) three core pro-inflammatory cytokines IL-1β, IL-6, and TNFα and microglial roundness (displayed in dark grey) and (B) of two core anti-inflammatory cytokines IL-4 and IL-10 and the aspect ratio of microglia per KO animal and treatment condition in relation to the CTRL sample. Data are expressed as mean + S.E.M, one-way ANOVA with Turkey’s multiple comparisons test, *p < 0.05, **p < 0.01, ***p < 0.001, and ****p < 0.0001, n = 5–7 mice per group.

