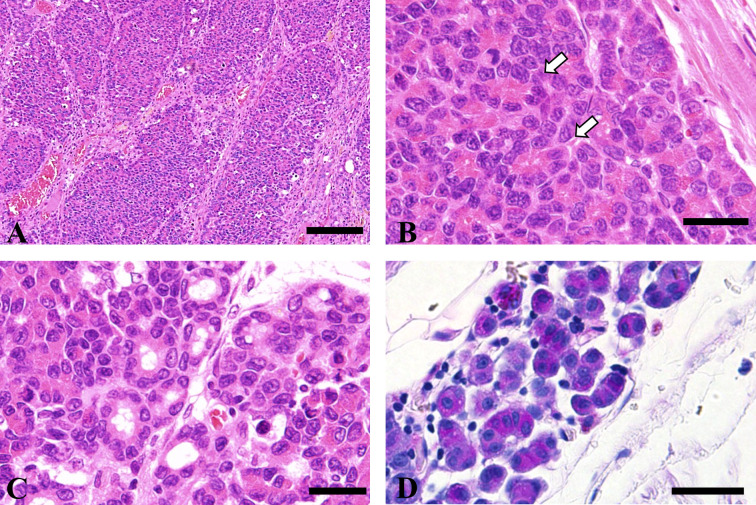
Fig. 2.
Histopathology of the mass in the thoracic cavity. (A) Large and small alveolar lesions separated by connective tissue. HE stain. Bar=100 μm. (B) Tumor cells form acinar structures (white arrow). HE stain. Bar=20 μm. (C) Some tumor cells form small ducts. HE stain. Bar=20 μm. (D) Cytoplasmic granules of tumor cells composing acinar structures positively stained with periodic acid-Schiff stain. Bar=20 μm.

