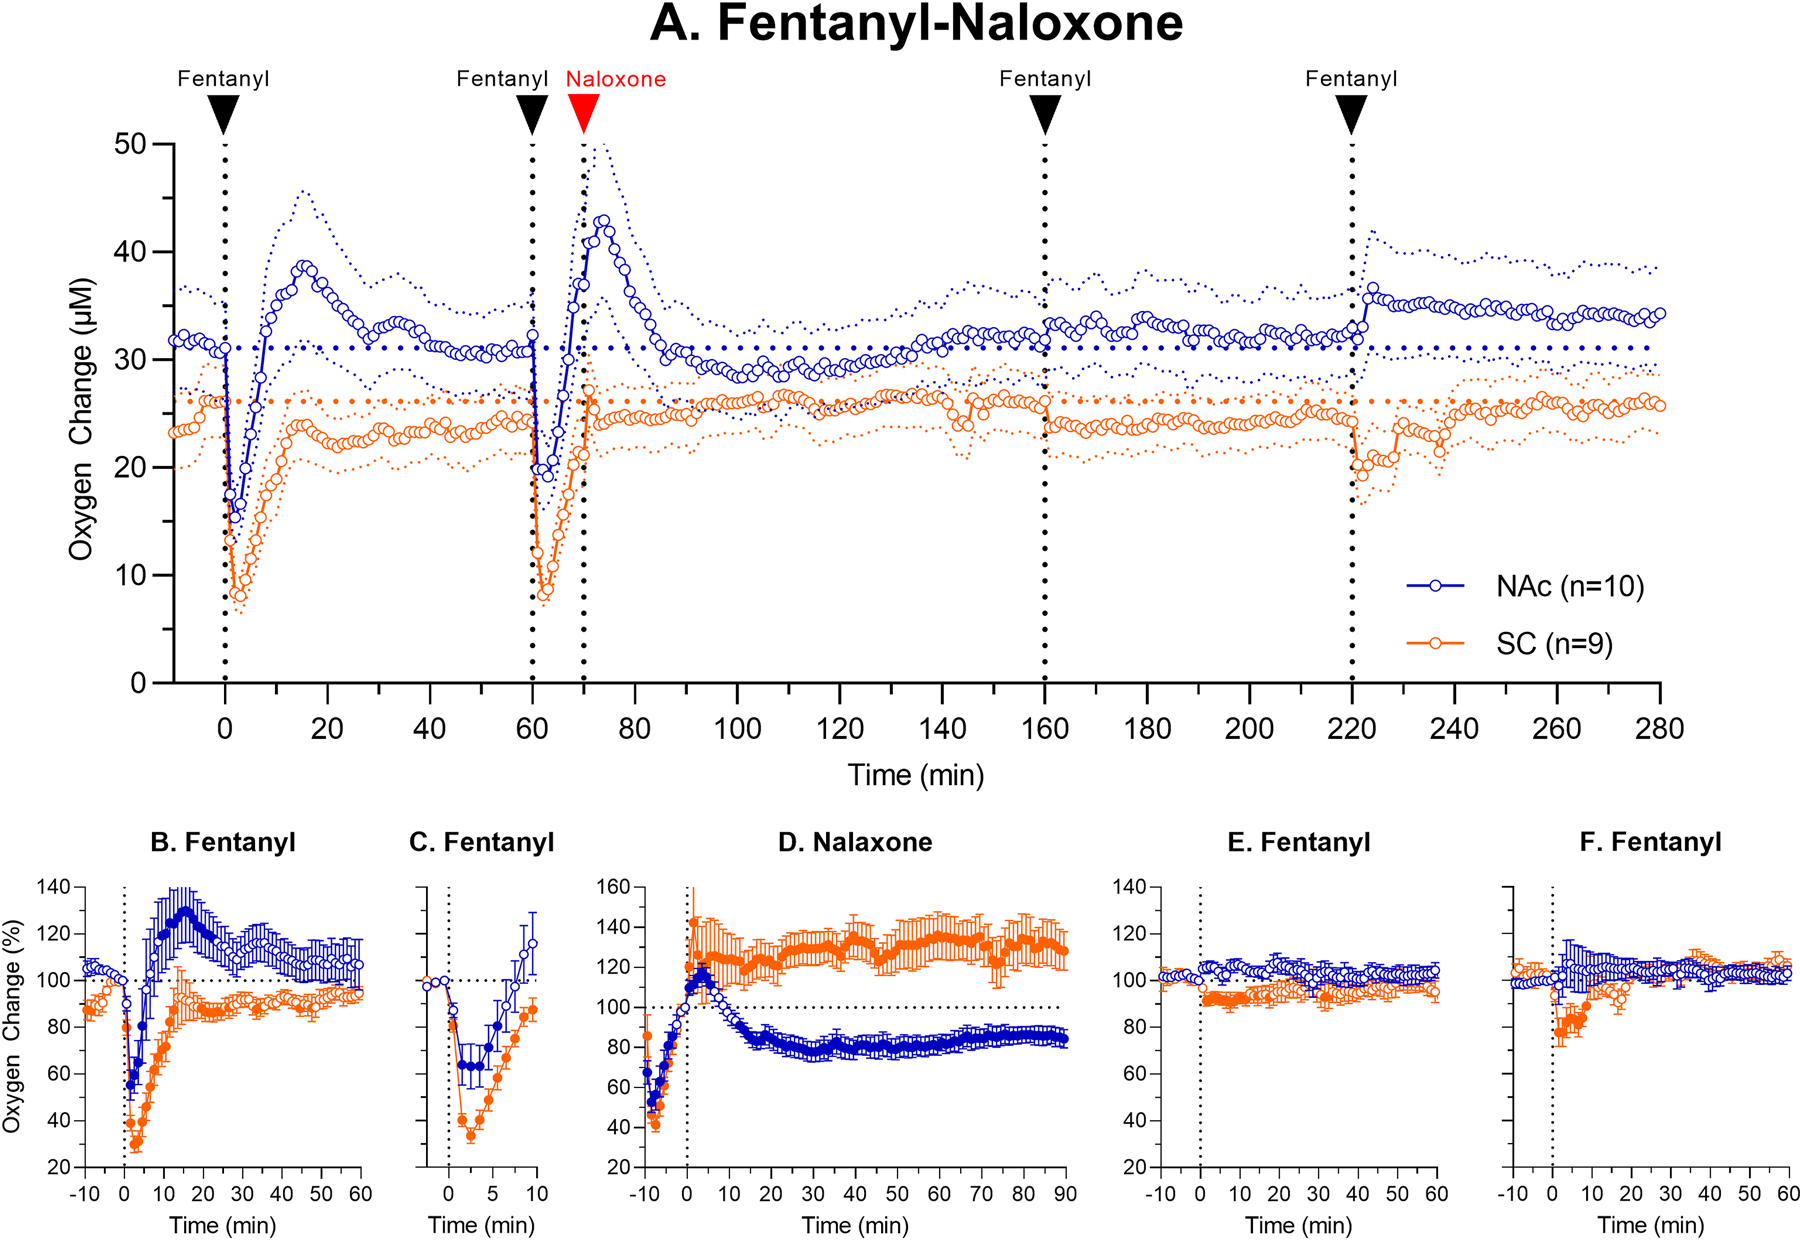
Figure 3.

Mean (±SEM) changes in oxygen levels in the NAc and SC space induced by iv fentanyl (20 μg/kg) before and after iv administration of naloxone (0.2 mg/kg). Top graph (A) shows changes in oxygen levels during the entire session ((μM) and lower graphs show relative changes (%) after each subsequent drug injection (B, fentanyl; C, fentanyl; D, naloxone; E, fentanyl and F, fentanyl). Filled symbols show values significantly different from pre-injection baseline (p<0.05).
