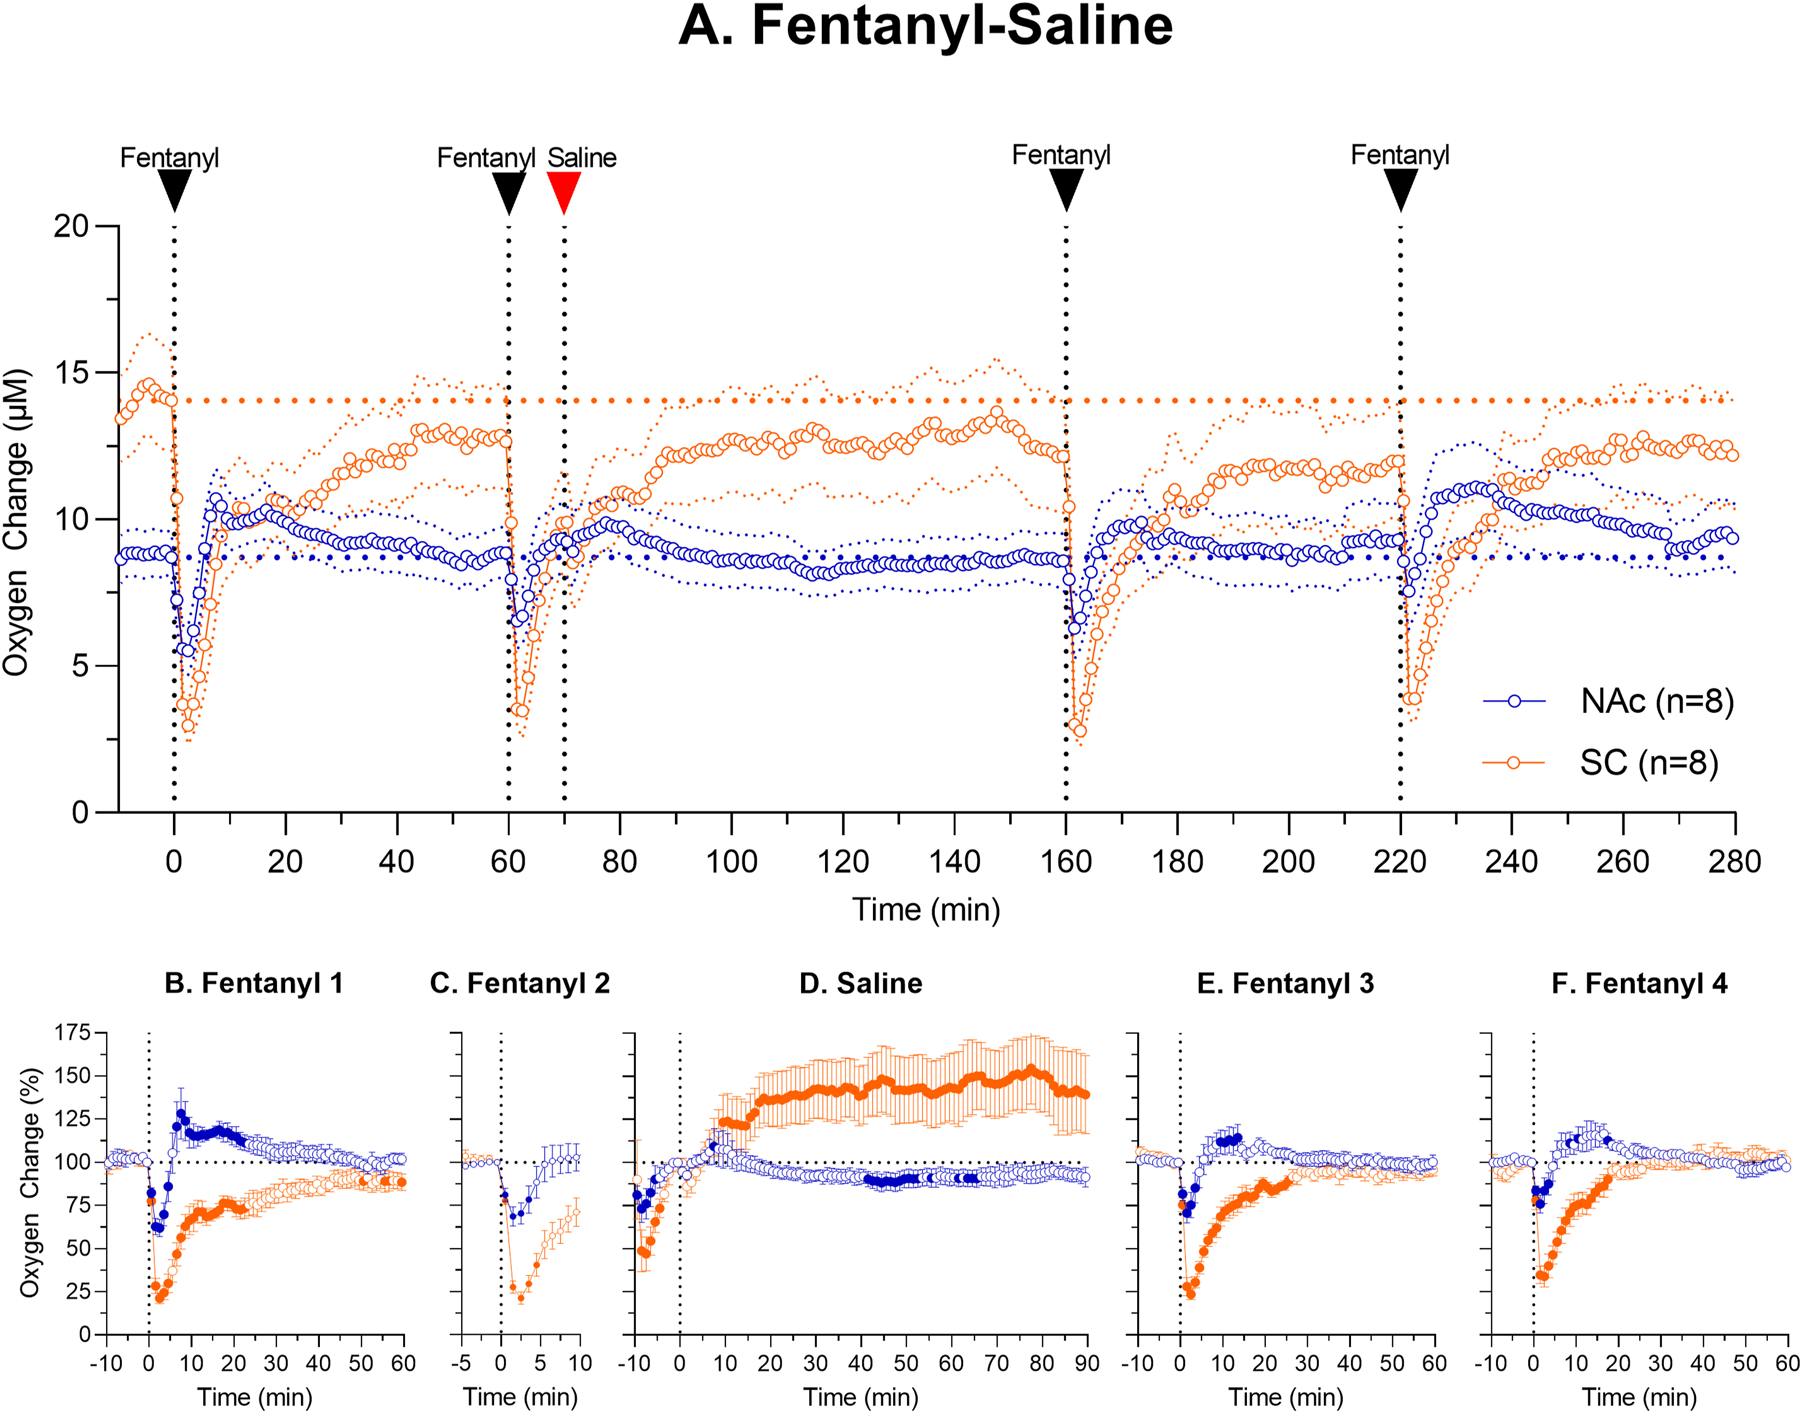
Figure 4.

Mean (±SEM) changes in oxygen levels in the NAc and SC space induced by iv fentanyl (20 μg/kg) before and after iv administration of saline. Top graph (A) shows absolute changes in oxygen levels during the entire session (μM) and lower graphs show relative changes after each injection (B, fentanyl; C, fentanyl; D, saline; E, fentanyl and F, fentanyl). n = numbers of averaged tests. Filled symbols show values significantly different from pre-injection baseline.
