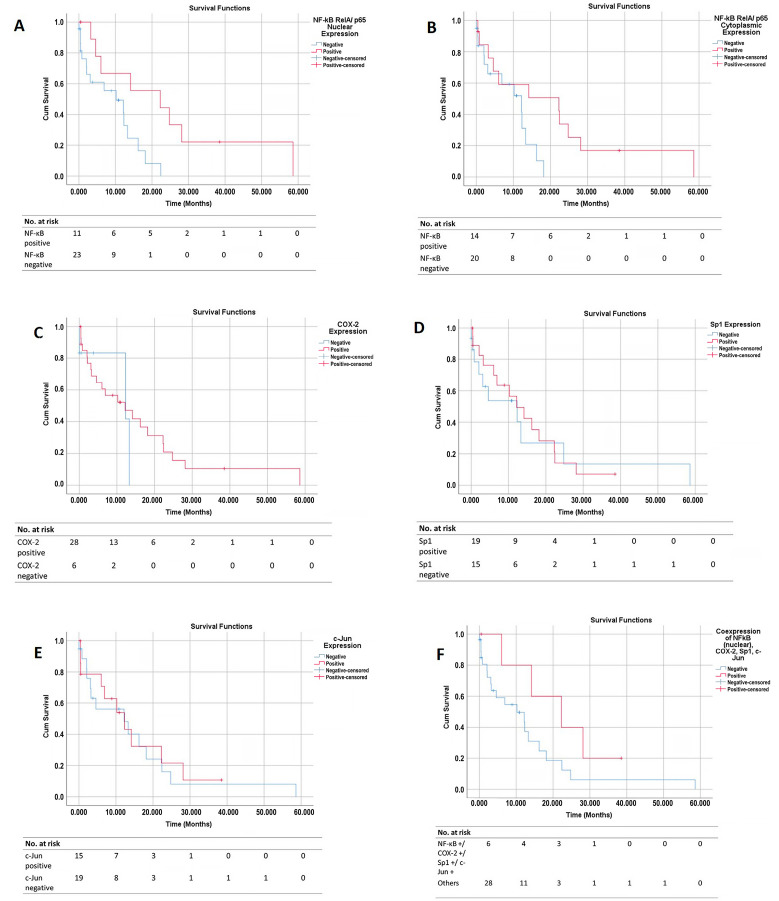
Figure 5.
Overall survival (OS) curves based on the protein expression in PDAC tissues. The graphs show the OS curves based on (A) NF−κB (RelA) nuclear expression, (B) NF−κB (RelA) cytoplasmic expression, (C) COX−2 expression, (D) Sp1 expression, and (E) c−Jun expression. (F) OS curve of patients with co−expressions of all four proteins vs. other patient groups. OS, overall survival; COX−2, Cyclooxygenase−2; NF−κB, Nuclear Factor Kappa−B; and Sp1, Specificity Protein 1.

