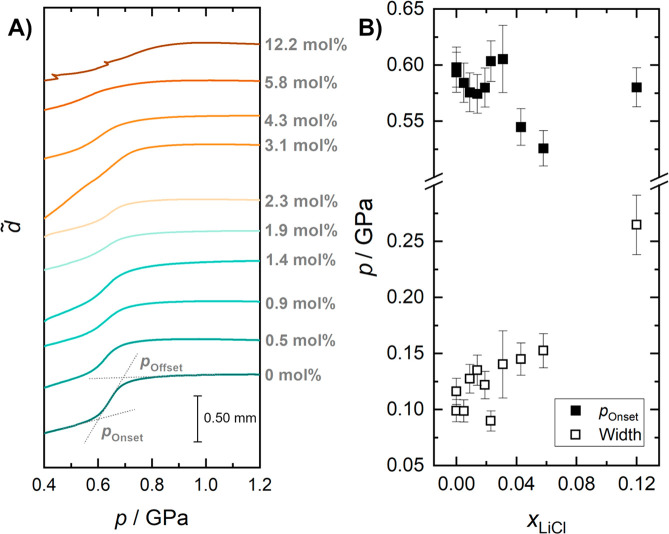
Figure 1.
(A) Piston displacement d̃ vs pressure of the hyperquenched samples (0–5.8 mol %, R = ∞–16.2) and the CS (12.2 mol %, R = 7.2) at 77 K. The curves have been corrected for the slope at ∼1 GPa and are stacked for clarity. Roughly 200–400 mg were loaded into the cell, but the exact sample mass is unknown. Therefore, no normalization relative to the amount of sample could be performed, and absolute densification cannot be quantified. A straight line at ∼1 GPa, after the steplike change in density, was subtracted from the raw data (shown in Figure S1 in the Supporting Information) to compensate for the compressibility of the high-density glasses. For pure water, a change in piston displacement of ∼0.50 mm was observed for the steplike feature, which implies that ∼390 mg of sample were loaded (see Figure S1). The onset/offset pressure pOnset/pOffset is defined by the intersection of the extrapolated baseline with a tangent aligned to the inflection point of the sigmoidal increase as indicated in the curve for pure water. (B) Onset pressure (filled squares) and width (empty squares) of the polyamorphic transition with increasing mole fraction of LiCl, where width is defined as pOffset – pOnset.

