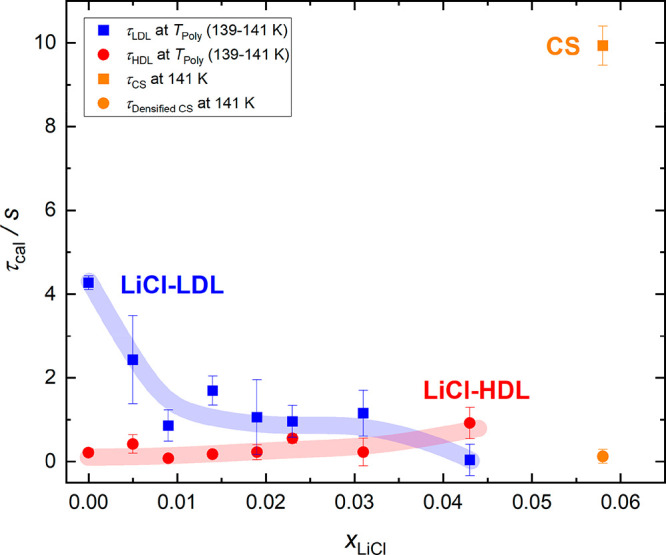
Figure 10.

Calorimetric relaxation times τcal estimated from the heating rate dependency of Tg,1, Tg,2, and Tg,CS via eqs 1–5. Error bars indicate the estimated error based on the error of Eg that is obtained from the corresponding fits of eq 1 to our data. The relaxation times for LDL and HDL are shown at TPoly measured at 30 K min–1 (139–141 K). The relaxation times of CS are shown at the TOnset of the enthalpy relaxation at 30 K min–1 (141 K). Broad transparent lines serve as guides to the eye. τHDL and τLDL are the calorimetric relaxation times of LiCl-HDL and LiCl-LDL respectively. τDensified CS and τCS correspond to a (densified) CS and are highlighted in orange color.
