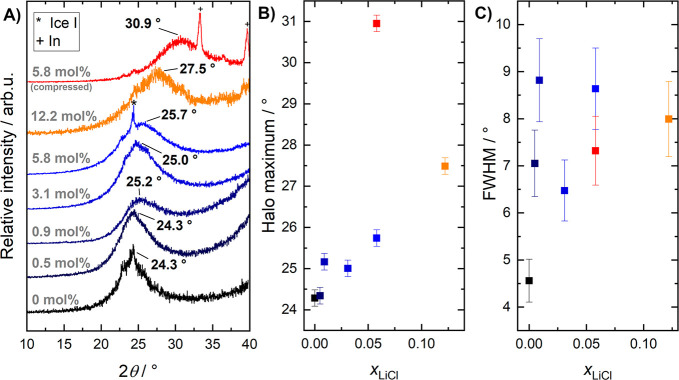
Figure 2.
(A) X-ray diffractograms of hyperquenched LiCl solutions before (different shades of blue) and after (red) compression. For comparison, the diffractogram of the slowly quenched CS (orange) is shown as well. All samples were measured as pellets at 80 K, except the CS which was loaded as a powder (see the Methods section). The diffractograms are stacked for clarity and normalized relative to the halo peak height at the labeled peak maximum. Bragg reflexes that correspond to impurities of ice I or indium were marked accordingly. (B) Position of the halo peak maximum as a function of the mole fraction of LiCl (xLiCl). (C) Full width at half-maximum (fwhm) of the halo peaks shown in panel (A).

