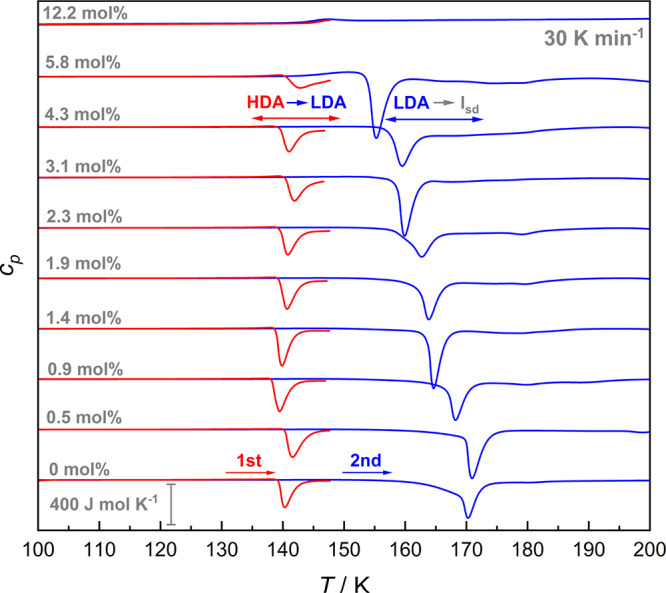
Figure 4.

First (red) and second (blue) heating trace (30 K min–1) of the quench-recovered LiCl-HDA samples made from LiCl-HGW (0–5.8 mol %, R = ∞–16.2). The first heating scan shows the thermal behavior of LiCl-HDA while the second one (obtained after recooling from ∼148 K) corresponds to the one of LiCl-LDA. For comparison, the thermograms of compressed CS (12.2 mol %, R = 7.2) are included. The traces are normalized to the moles of water as described in the Methods section and shifted for clarity.
