Figure 6.
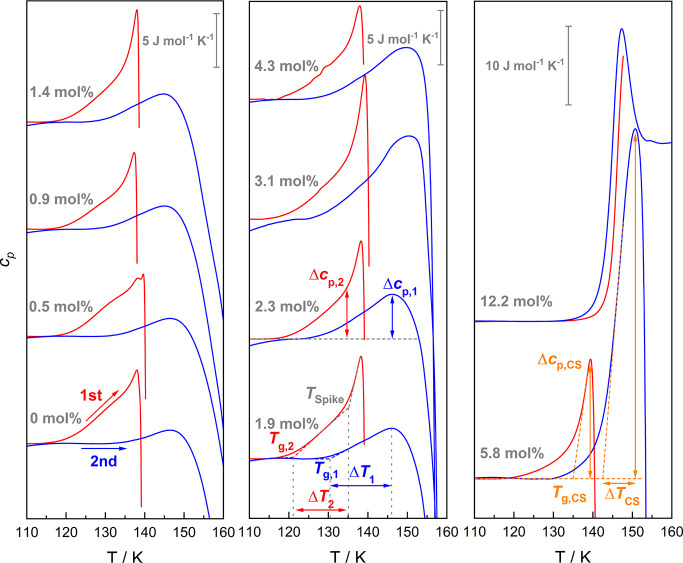
Magnification of the traces in Figure 4 with a focus on the glass-to-liquid transitions. Tg,2 and Tg,1 marked for the 1.9 mol % scan are the glass transition temperatures of LiCl-HDA (red) and LiCl-LDA (blue), respectively. TSpike is the onset temperature of the spike-like feature that commences right after Tg,2. Tg,CS corresponds to the glass transition temperature of a concentrated solution and is only observed at ≥5.8 mol % (R < 16.2). The definitions for the change in heat capacity (Δcp,2 (LiCl-HDA), Δcp,1 (LiCl-LDA), and Δcp,CS (CS) are marked in the traces of the 2.3 mol % and the 5.8 mol % sample, respectively. The width of the glass transition ΔT2 (LiCl-HDA), ΔT1 (LiCl-LDA), and ΔTCS (CS) is defined as indicated for the 1.9 mol % and 5.8 mol % samples.

