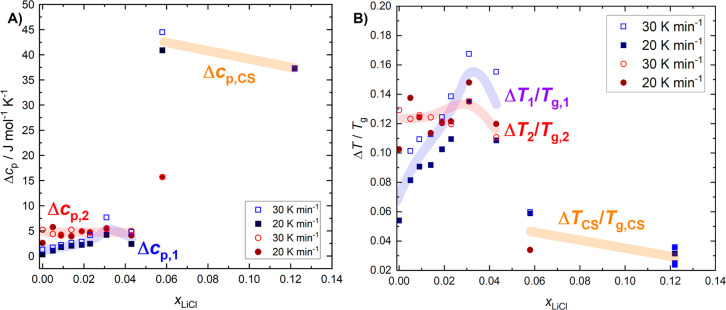
Figure 9.
(A) Change in heat capacity (Δcp) per mole of water in the sample and (B) relative width of the glass transition ΔT/Tg as a function of xLiCl. Broad transparent lines serve as a guide to the eye. The observed trends are similar for all heating rates (see the Supporting Information) but, for simplicity, only the results for 30 and 20 K min–1 are shown. The definitions of Δcp and ΔT/Tg are shown in Figure 6. Textbook definitions of Δcp and ΔT/Tg are not useful for our DSC traces, since no unambiguous end point could be determined due to the exothermic features (polyamorphic transition or cold crystallization) commencing right after the glass transitions. For consistency, the same procedures were applied to the CS. The error estimated for Δcp is roughly 0.4 J mol–1 K–1 and that for ΔT/Tg is ∼0.01. Error bars are omitted for clarity.

