Fig. 3.
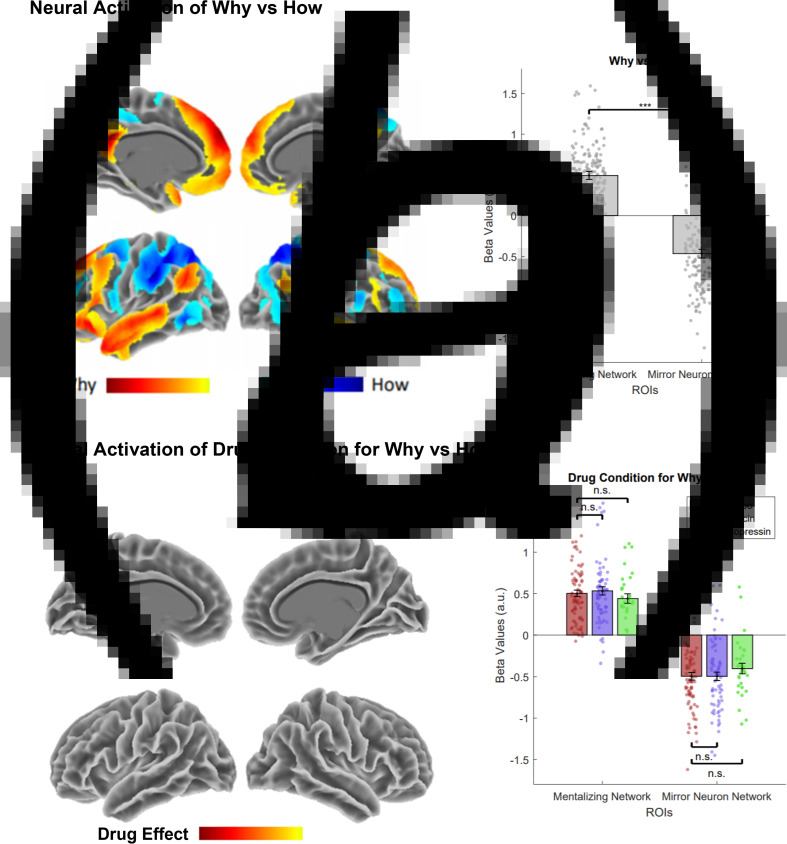
Differences in neural activity found via t tests contrasting the effects of either OT or AVP v. placebo. (a) Neural activation of Why v. How, (b) neural activation of drug condition for Why v. How. (a) The contrast of Why v. How activation collapsed across all conditions shows robust activation in the mentalizing network ROI for Why trials and mirror network ROI for How trials. Warmer colors correspond to greater activation during Why trials and cooler colors to greater activation during How trials. (b) The graph on the right shows there is no significant difference in neural activation for either OT or AVP v. placebo (p > 0.05) in the mentalizing network ROI for Why trials and mirror network ROI for How trials. The maps on the left show no significant activation (p < 0.001 uncorrected) for either drug condition. Error bars represent standard error. p < 0.001***, p < 0.01**, p < 0.05*, p < 0.10♱, n.s. = not significant.

