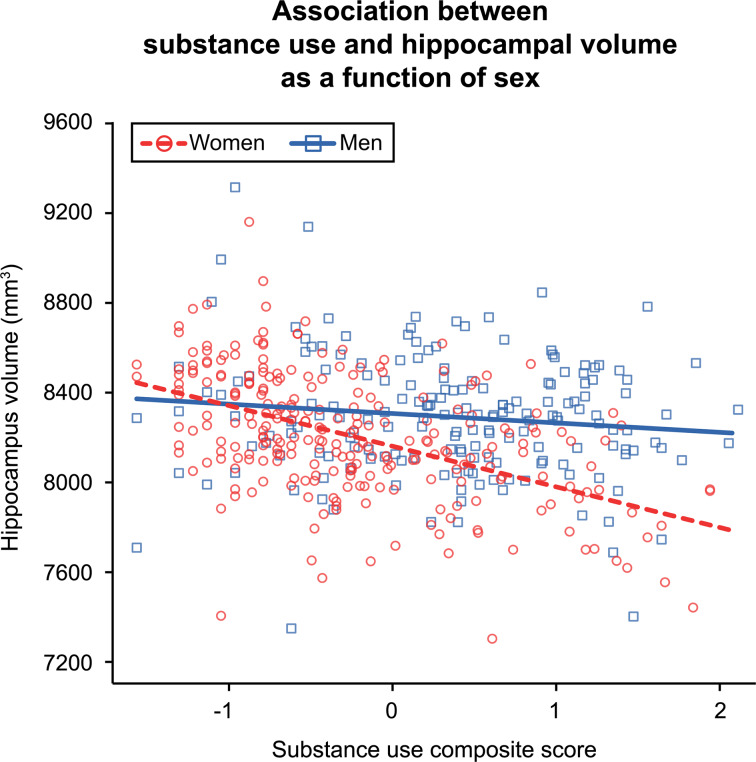
Fig. 1.
Plot depicts the individual-level phenotypic interaction between substance use composite scores and sex. Lines represent the linear mixed model fit lines for the interaction term. Greater substance use was associated with significantly lower hippocampal volume in women but not men. The visreg R package (Breheny & Burchett, 2017) was used to create the partial residual plot.

