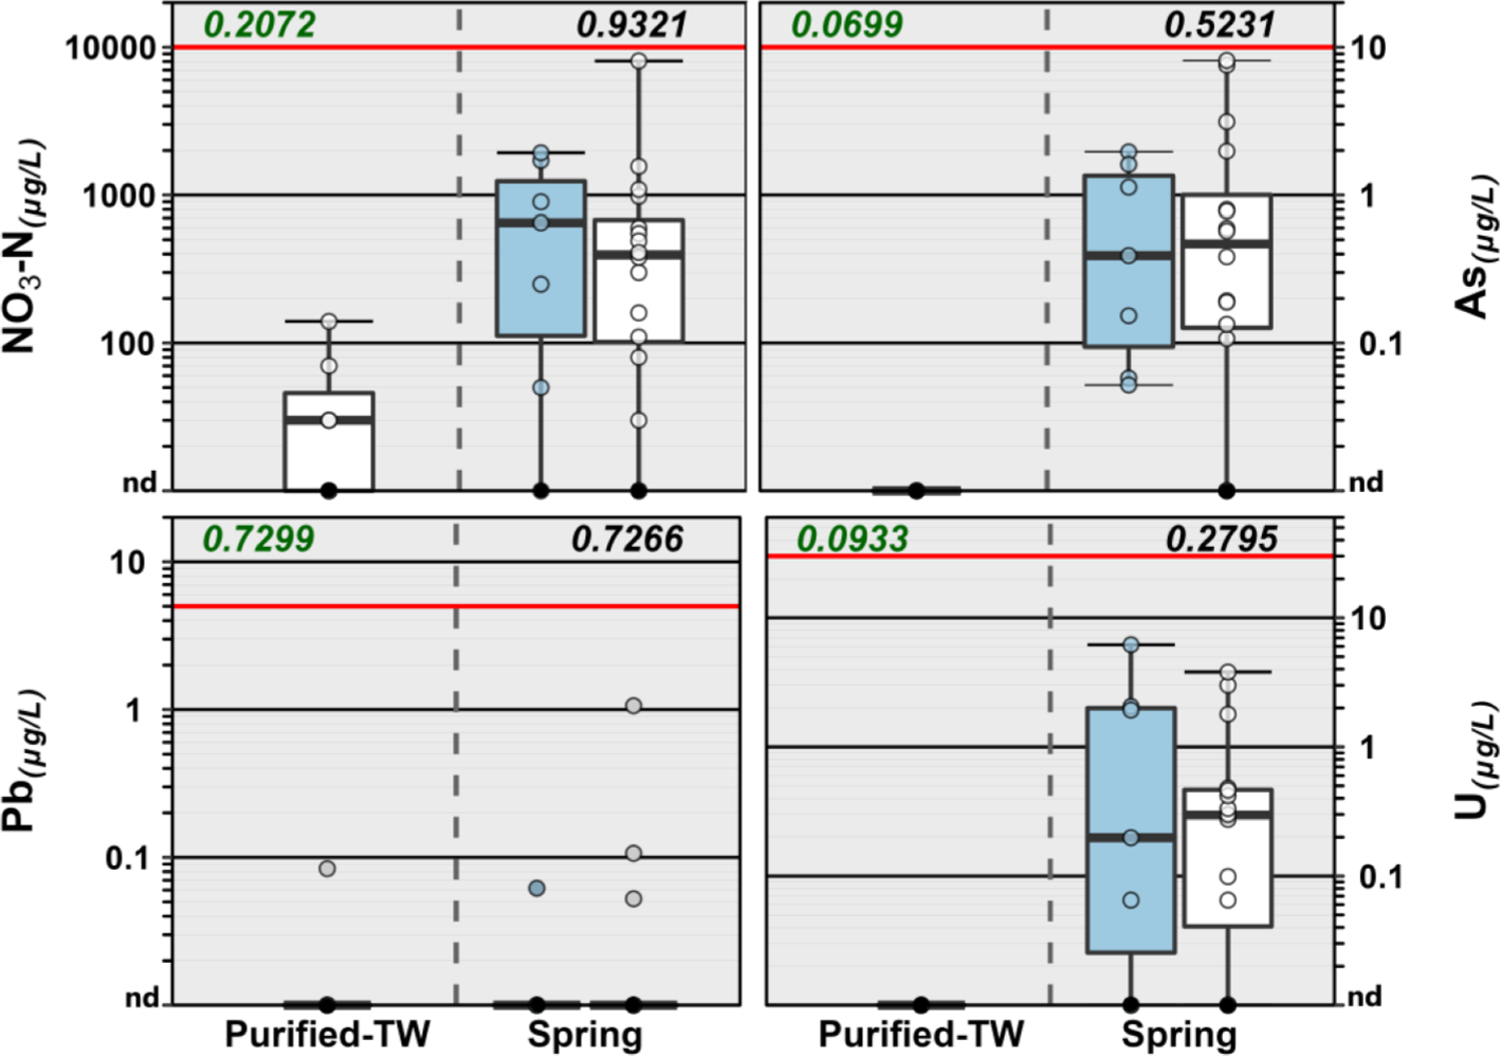
Fig. 1.

Group comparison of concentrations of select inorganics detected in purified-TW (domestic) and spring (domestic, white; imported, blue) sourced bottled water samples during 2020. Solid red lines indicate enforceable FDA SOQ levels. EPA MCLG for As, U, and Pb are zero. For NO3-N, SOQ and MCLG are the same. Boxes, centerlines, and whiskers indicate interquartile range, median, and 5th and 95th percentiles, respectively. Numbers in green font (top left of plots) indicate the permuted probability that the centroids and dispersions are the same (PERMANOVA; 9999 permutations) across all (purified-TW and spring sourced) BW groups; numbers above spring-sourced BW boxplot pairs (top right of plots) indicate the permuted probability that the centroids and dispersions are the same for spring-sourced BW groups. “nd” indicates not detected.
