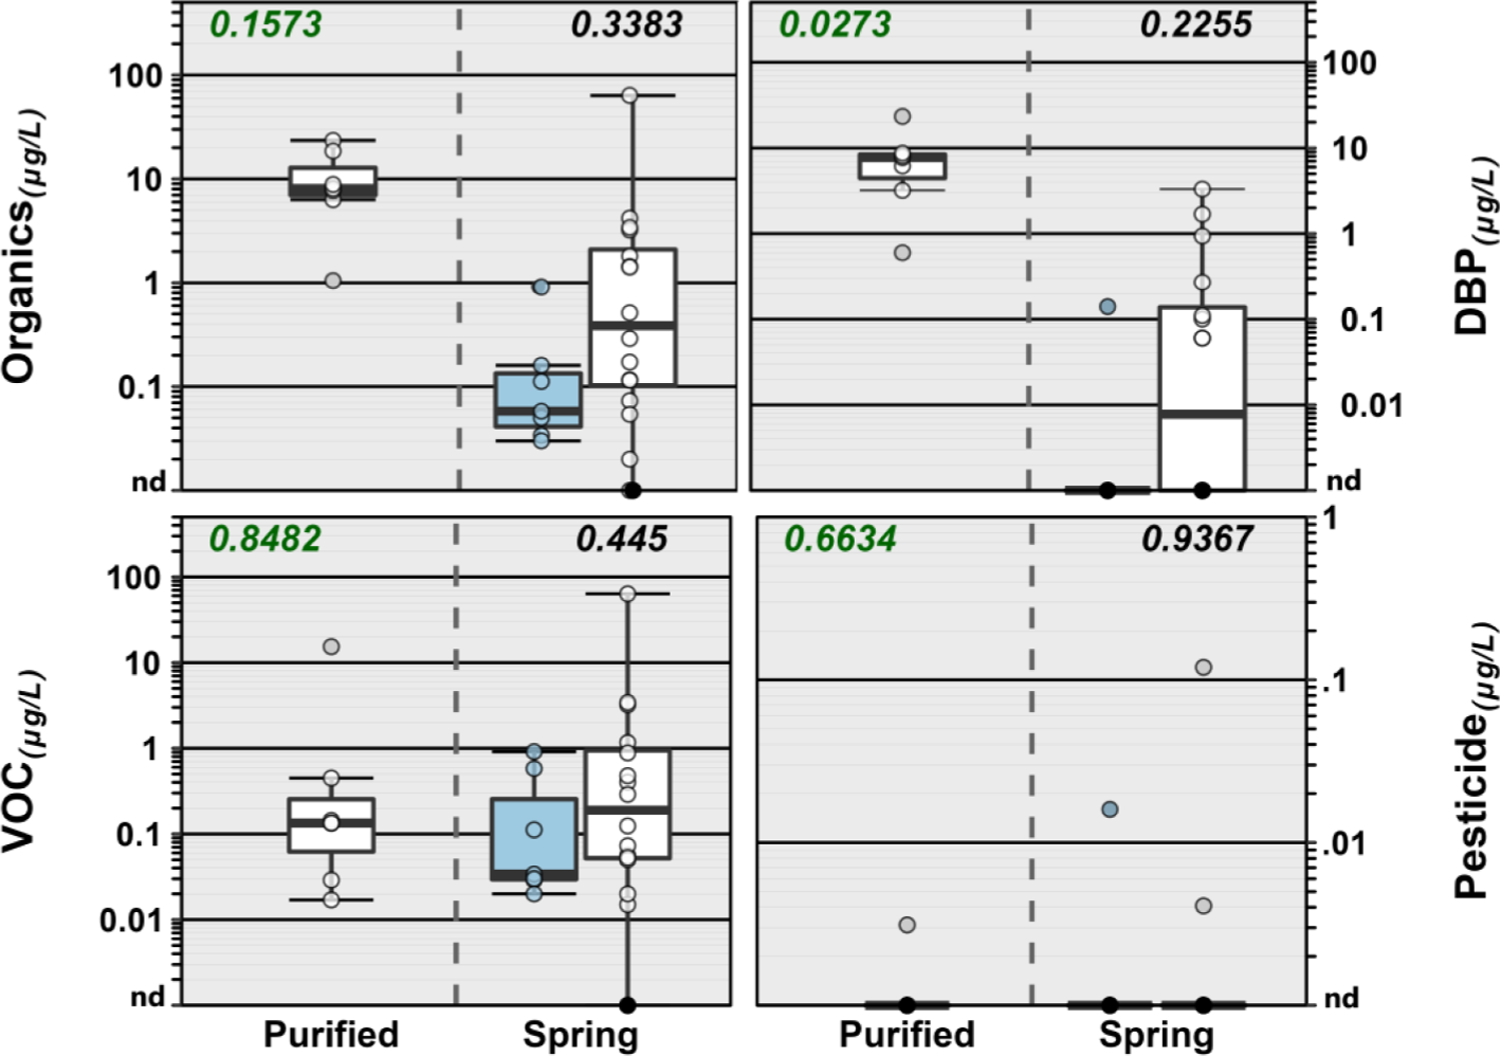
Fig. 4.

Group comparisons of cumulative concentration of all organics (upper left plot) and select organic classes detected in spring (domestic, white; imported, blue) and purified-TW (domestic) sourced bottled water samples during 2020. Boxes, centerlines, and whiskers indicate interquartile range, median, and 5th and 95th percentiles, respectively. Numbers in green font (top left of plots) indicate the permuted probability that the centroids and dispersions are the same (PERMANOVA; 9999 permutations) across all (purified-TW and spring sourced) BW groups; numbers above spring-sourced BW boxplot pairs (top right of plots) indicate the permuted probability that the centroids and dispersions are the same for spring-sourced BW groups. “nd” indicates not detected.
