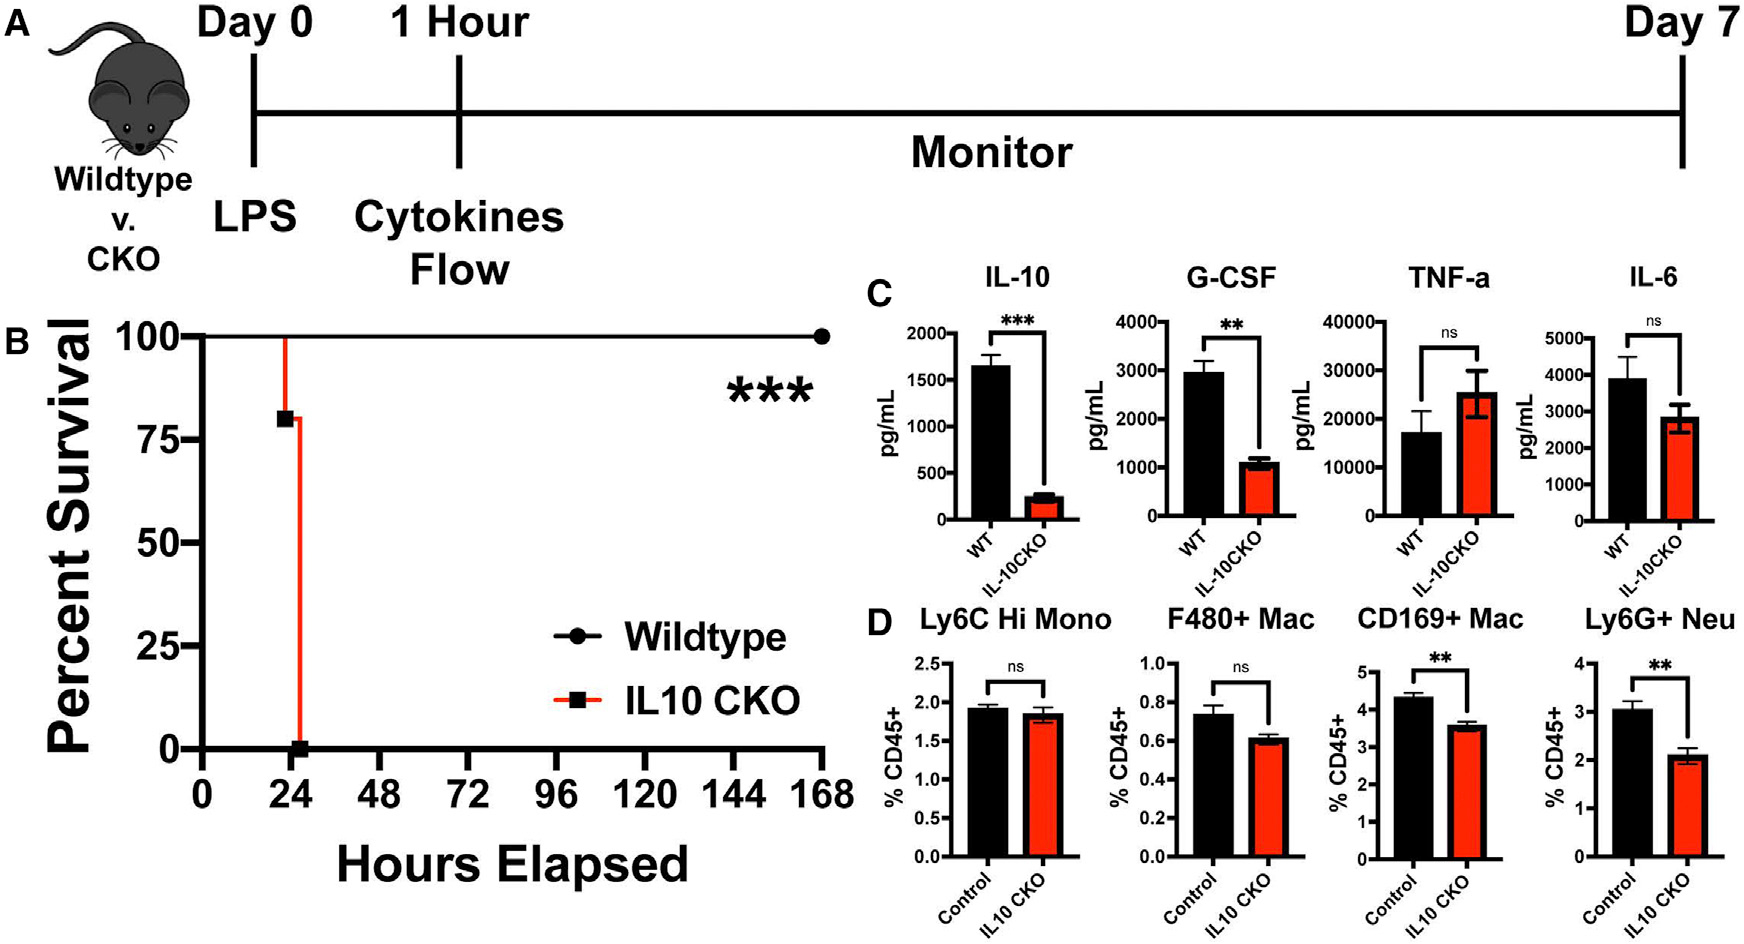
Figure 6. IL-10 production by CD169+ macrophages is required for LPS-induced sepsis protection.

(A) Experimental timeline of LPS challenge of control vs. CD169-IL-10 CKO (IL-10 CKO).
(B) Survival curve between control and IL-10 CKO mice following 75 μg LPS.
(C) (Left to right) IL-10, G-CSF, TNF-α, and IL-6 cytokine levels following 1 h post LPS between control vs. IL-10 CKO.
(D) (Left to right) Splenic Ly6C Hi monocytes, F4/80+ macrophages, CD169+ macrophages, and Ly6G+ neutrophil flow cytometric analysis following 1 h post LPS between control vs. IL-10 CKO mice.
**p < 0.01, ***p < 0.001, ns, not significant. n = 3–5/group and of 2 independent experiments.
