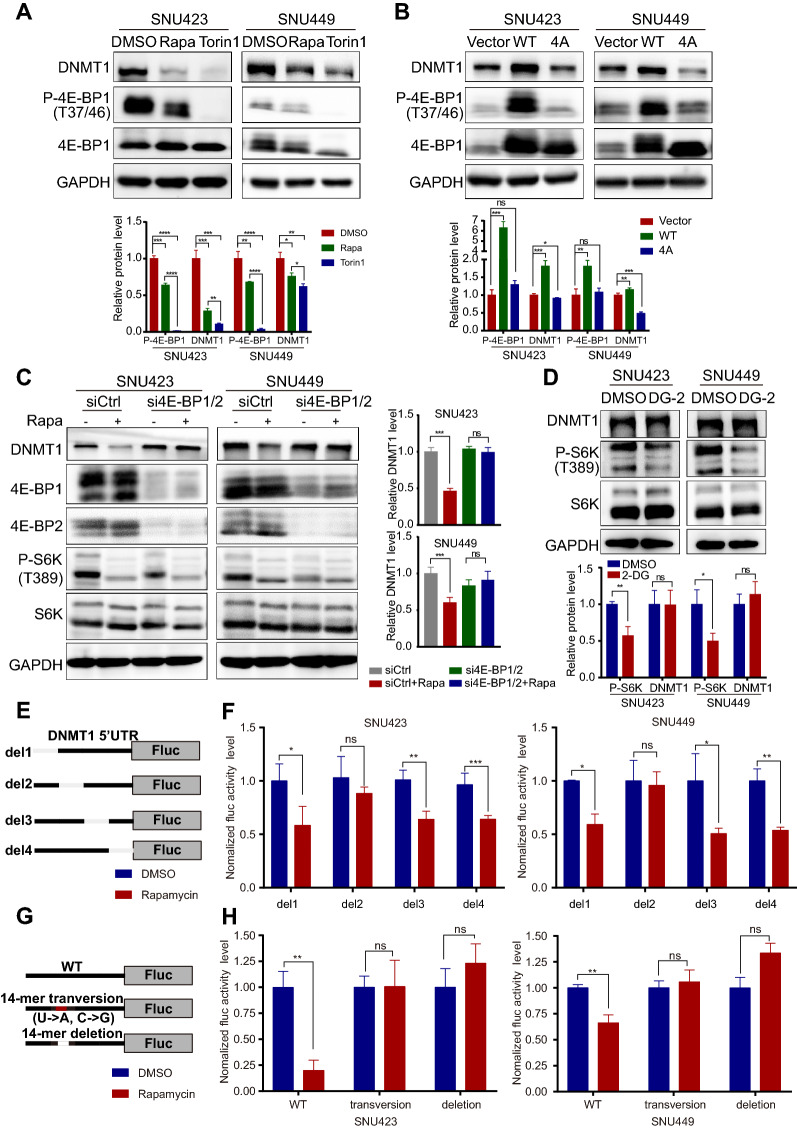
Fig. 6.
Phosphorylation of 4E-BP1 controls the posttranscriptional expression of DNMT1. A Effect of the mTOR inhibitors Torin1 (250 nM) and rapamycin (500 nM) on the DNMT1 level in SNU423 and SNU449 cells. Cells were treated for 24 h with the indicated drugs, and protein levels were subsequently analysed by Western blotting. B Protein levels in SNU423 and SNU449 cells transfected with WT 4E-BP1 or the 4E-BP1 mutant (T37A, T46A, S65A, and T70A) (4E-BP1-4A). C Representative Western blot analysis of SNU423 and SNU449 cells after 48 h of treatment with 4E-BP1/4E-BP2 siRNA followed by 24 h of treatment with rapamycin (500 nM). D Representative Western blot of SNU423 and SNU449 cells after 48 h of DG-2 treatment. The values for P-S6K and P-4E-BP1 were normalized against the band intensities of S6K and 4E-BP1. E Schematic showing the insertion of the DNMT1 5′UTR (uc010xlc.2) into pGL3-promoter. F Firefly luciferase activity in SNU423 and SNU449 cells after transfection of the respective 5′UTR constructs followed by 24 h of treatment with rapamycin (500 nM). G Schematic showing the insertion of the DNMT1 5′UTR constructs [WT, transversion mutant, and PRTE deletion mutant (position − 116 ~ − 129, uc010xlc.2)] into pGL3-promoter. H Firefly luciferase activity in SNU423 and SNU449 cells after transfection of the separate 5′UTR constructs followed by 24 h of treatment with rapamycin (500 nM). Data were presented as mean ± SD and each assay was performed for three times. Ns, not significant, *P < 0.05, **P < 0.01, ***P < 0.001, ****P < 0.0001

