Fig. 3.
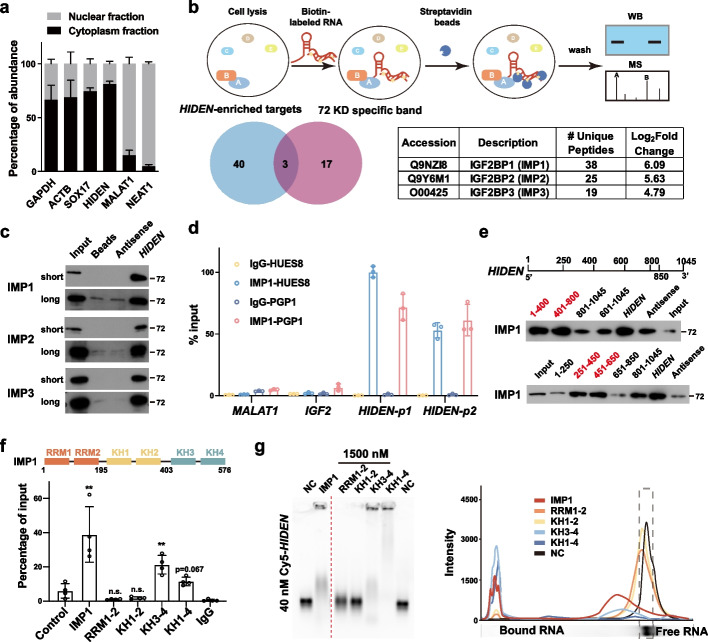
HIDEN physically interacted with IMP1. a Subcellular localization of HIDEN in DE cells determined by RT-qPCR following nucleo-cytoplasmic separation (n = 6). b The schematic diagram of RNA pulldown was shown on the top. Venn diagram indicates the overlapped hints identified by mass spectrometry of the specific band around 72 kDa (unique peptides ≥ 4, red circle) and whole extracts (unique peptides ≥ 10 in HIDEN-pulldown group and log2(fold-change (HIDEN/Antisense)) > 2.32, blue circle). The unique peptides and log2(fold-change) of IMP1/2/3 compared to antisense in mass spectrometry data of HIDEN-pulldown group were shown in the table. c Immunoblot for IMP1, IMP2, and IMP3 after RNA pulldown in DE cells. Beads and antisense were used as negative controls. Pictures captured for short and long exposure time were shown. d IMP1 RIP followed by RT-qPCR in DE cells of two PSC lines, PGP1 and HUES8 (n = 3). RNA levels were normalized to input. e Mapping the IMP1-binding region in HIDEN in 293 T cells. Top, diagrams of full-length HIDEN and the deletion fragments used in RNA pulldown. Bottom, immunoblot for IMP1 in protein samples pulled down by different HIDEN fragments. f Mapping the HIDEN-binding domain in IMP1 protein. Domain structure of IMP1 protein (top). FLAG-tagged IMP1 or IMP1 mutants and HIDEN were co-overexpressed in 293 T cells and FLAG RIP was performed to examine the enrichment of HIDEN (bottom). g Electrophoretic mobility shift assay (EMSA) results of in vitro binding assays. Cy5-labeled HIDEN RNA (40 nM) were transcribed in vitro and His-tagged IMP1 proteins (1500 nM) were purified from E. coli

