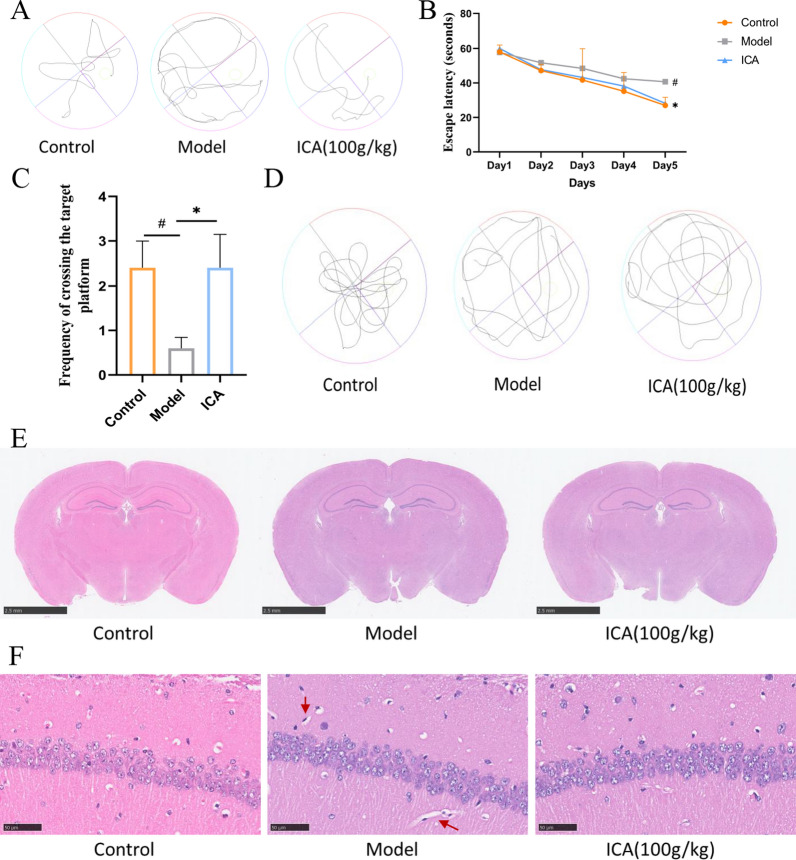
Fig. 1.
MWM test and HE staining of the control, model, and ICA groups. A, B Representative photos of the swim pathways A and escape latency B to locate the concealed platform during days 1–5. C, D The number of platform crossings C and the representative photos of target platform crossing frequency D on day 6, after removing the platform. Data are expressed as mean ± SEM (n = 6/group). *P < 0.05 and **P < 0.01 vs. the control group and #P < 0.05 vs. the model group. E, F HE-stained brain sections from each group. The red arrows indicate distorted nerve cells. MWM test, Morris Water Maze test, ICA, icariin; HE, hematoxylin and eosin

