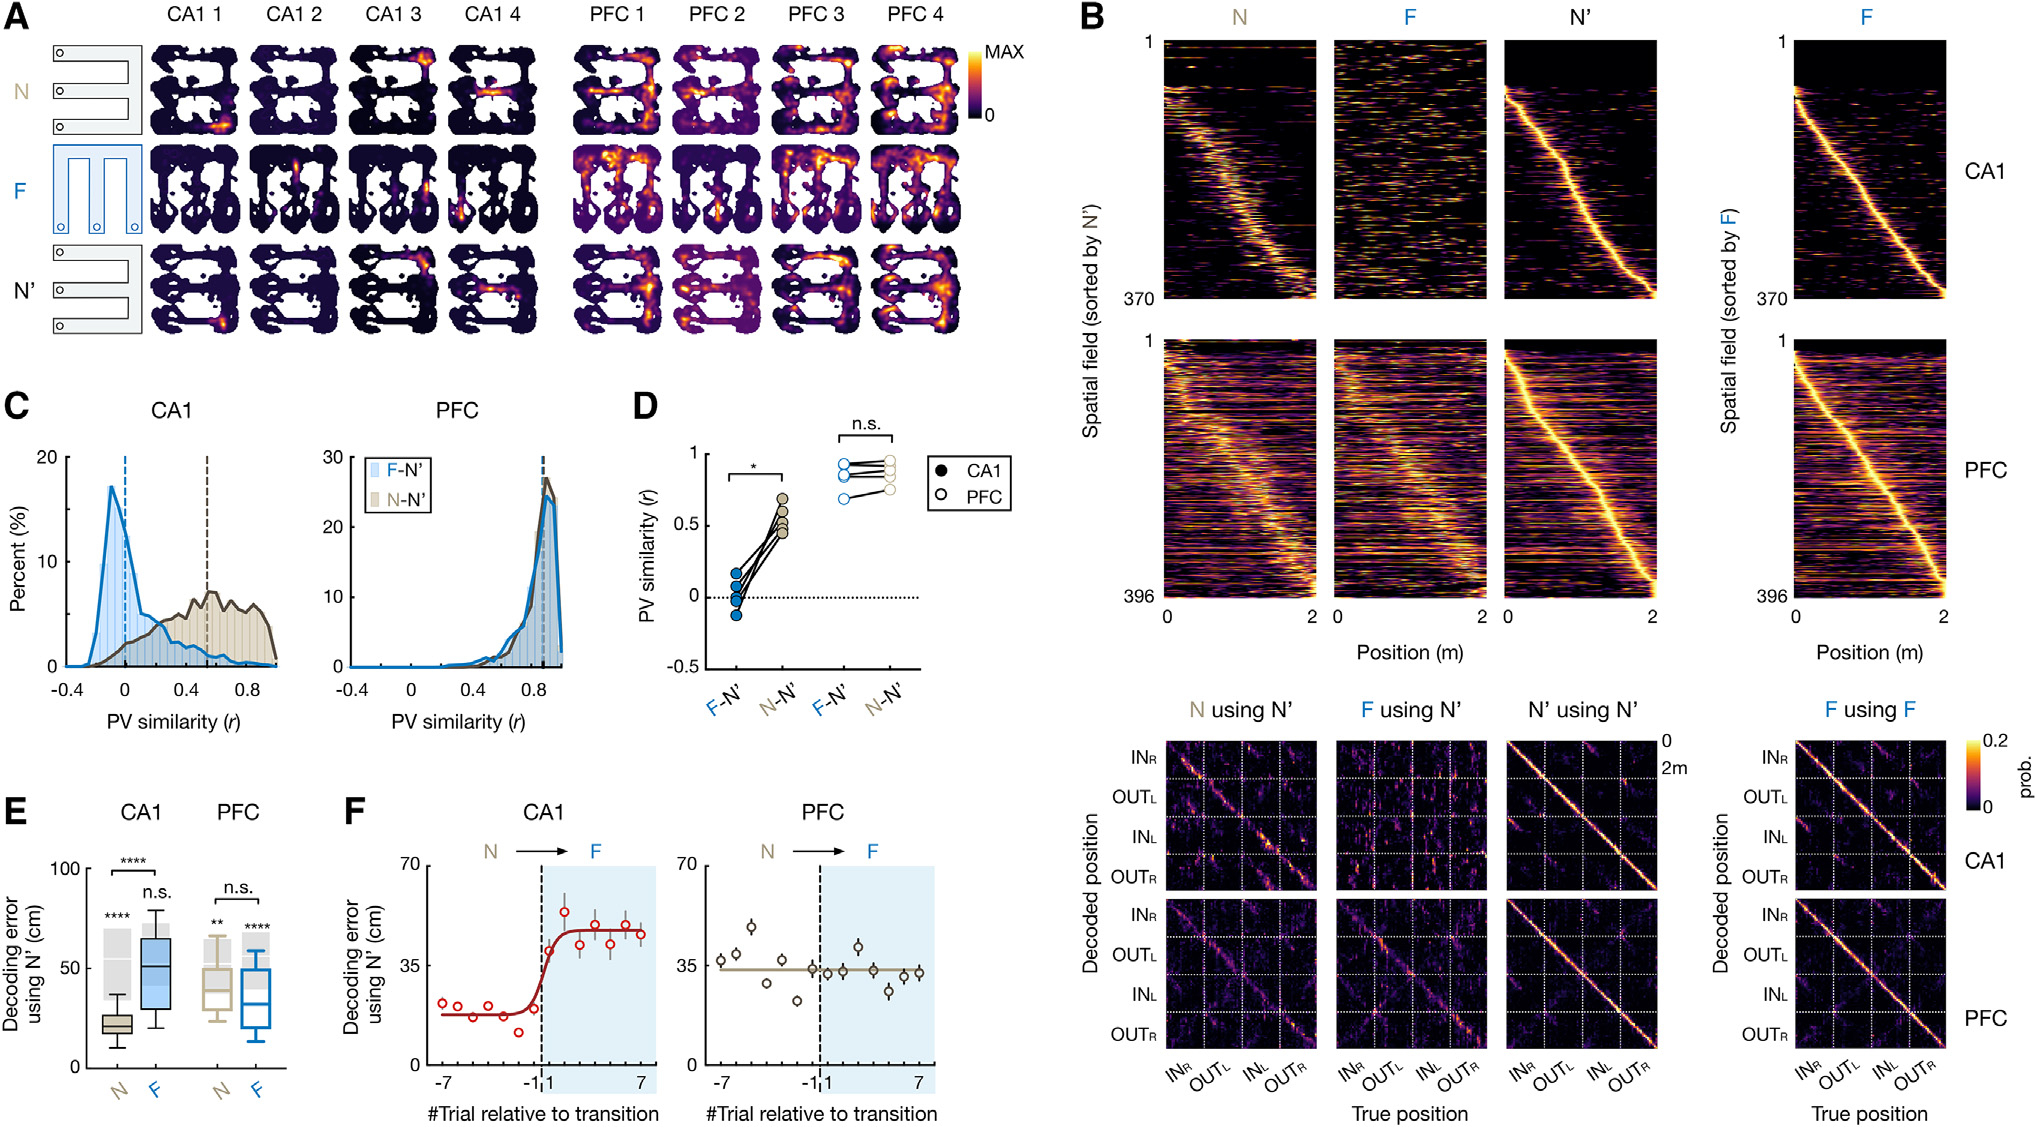
Figure 2. Hippocampus shows global remapping, whereas prefrontal spatial representations generalize across environments.

(A) 2D rate maps of 4 CA1 and 4 PFC cells simultaneously recorded across environments (N, F, and N′).
(B) Top two rows: normalized rate maps on 2-m-long linearized trajectories of all spatial-tuned neurons tracked over environments, sorted by peak activity in N′ (left 3 columns) and in F (right). Bottom two rows: corresponding confusion matrices between true and decoded positions (with leave-one-out cross-validation; STAR Methods), where diagonal elements represent decoding accuracy.
(C and D) Population vector (PV) similarity across novel (N-N′; light gray) and familiar-novel (F-N′; blue) environments. Dashed vertical line on histogram: median. Each circle in (D) is for an animal (repeated-measures ANOVA with Tukey’s post hoc, , n.s., , *p = 0.01).
(E) Decoding error using spatial maps from N′. Kruskal-Wallis test with Dunn’s post hoc comparing N and F, n.s., , ****p < 0.0001. values above each box were computed by comparing with its cell-ID shuffles (shaded boxes; n.s., , **p = 0.0023, ****p < 0.0001, Wilcoxon paired test). Box plots show median, 75th (box), and 90th (whiskers) percentile.
(F) Trial-by-trial decoding error during environment switch (N to F; median ± SEMs; line, sigmoid fit). Trial −1 vs. 1: p(CA1) = 0.038, and p(PFC) > 0.99, Kruskal-Wallis test with Dunn’s post hoc.
See also Figures S2–S4.
