
Figure 3. Distinct geometric representations of task space in CA1 and PFC.
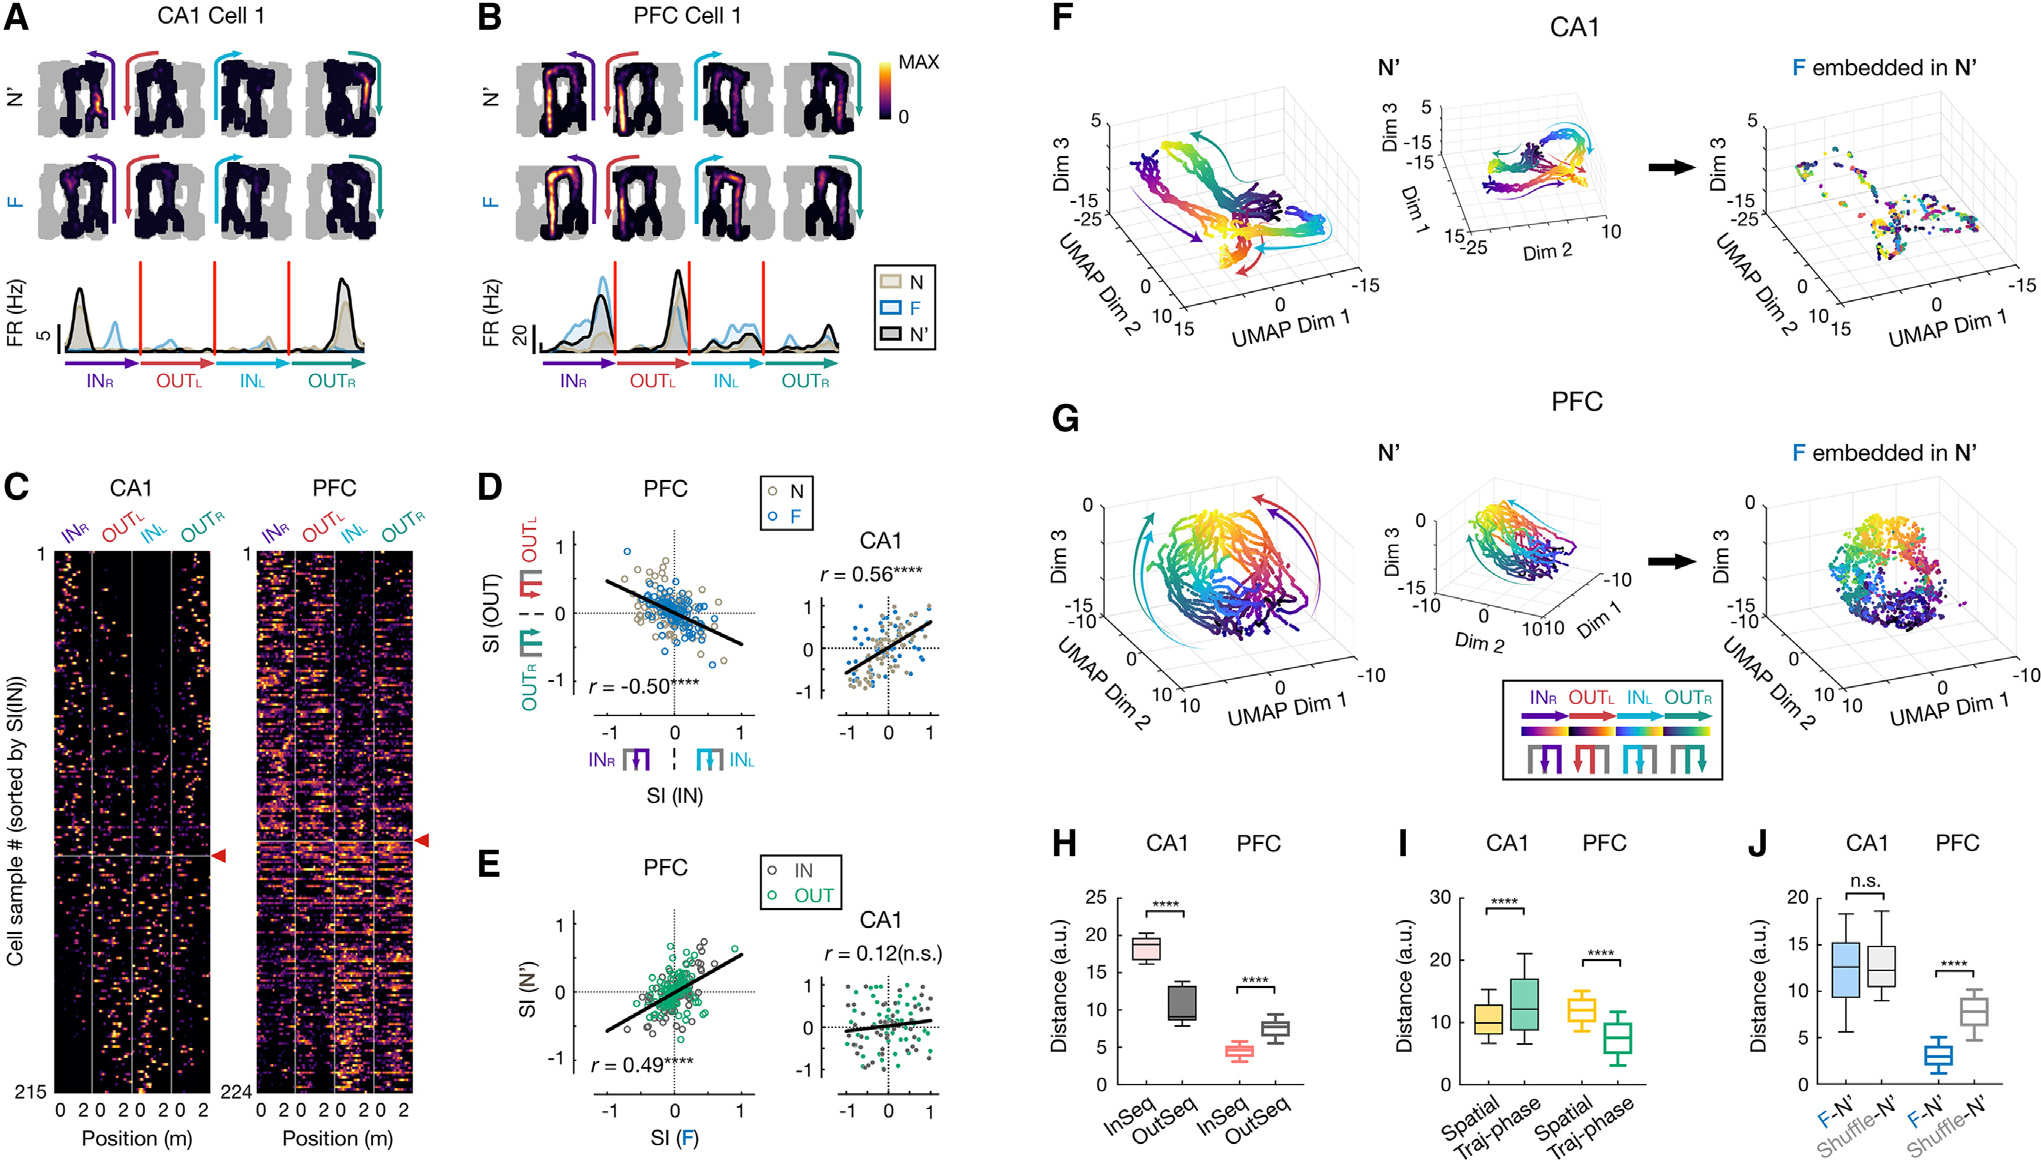
(A–E) CA1 and PFC neurons show distinct task-sequence selectivity.
(A and B) Firing fields on different trajectories of example (A) CA1 and (B) PFC cells. Top: 2D rate maps on each of 4 trajectories in the rewarded order (INR, OUTL, INL, OUTR, color coded) in N′ and F (all locations visited in a given session in gray). Bottom: corresponding rate maps on linearized trajectories (color-coded arrowheads indicate trajectory start and end).
(C) Linearized rate maps on the 4 trajectories of all spatially tuned neurons, sorted by selectivity index of inbound trajectories (i.e., SI(IN); INL vs. INR). The vertical lines separate each trajectory type. Horizontal line with a red arrowhead: division between cell samples with SI(IN) < 0 (above; selective to INR) vs.> 0 (below; selective to INL).
(D) Selectivity index of inbound against outbound trajectories (SI(IN) vs. SI(OUT); PFC, , ****p = 1.35e16; CA1, , ****p = 1.39e11; Pearson correlation).
(E) Selectivity index in familiar against novel environment (PFC, , ****p = 2.77e–14; CA1, , n.s., ; Pearson correlation). Dark gray: SI(IN); green: SI(OUT). Each dot is a cell sample, and lines show least-squares linear fits in (D) and (E).
(F and G) 3D unsupervised embeddings of neural manifolds using UMAP in (F) CA1 and (G) PFC. Each dot represents the populational neural state (same 98 and 171 cells for CA1 and PFC, respectively) at one spatial position of a single trajectory pass (color coded by trajectory types and phases). Arrow-headed lines on manifolds schematically illustrate direction of motion along trajectory phases (from start to end). Left and middle: two different views of the manifold from the N′ session. Right: embeddings of population activity from F, guided by its template from N′ (STAR Methods).
(H) Distance between pair of trajectories in manifold. InSeq, pair of trajectories in a correct task sequence (INR and OUTL or INL and OUTR); OutSeq, pair of trajectories out of the sequence (INR and OUTR or INL and OUTL).
(I) Distance between pair of neural states at same physical spatial locations or trajectory phases (traj-phases) in manifold.
(J) Distance between F and N′ neural manifolds. Shuffle: cell IDs of N′ activity randomly shuffled.
Box plots in (H)–(J) show median, 75th (box), and 90th (whiskers) percentile (rank-sum tests, n.s., , ****p < 0.0001).
See also Figures S5 and S6.