
Fig. 4.
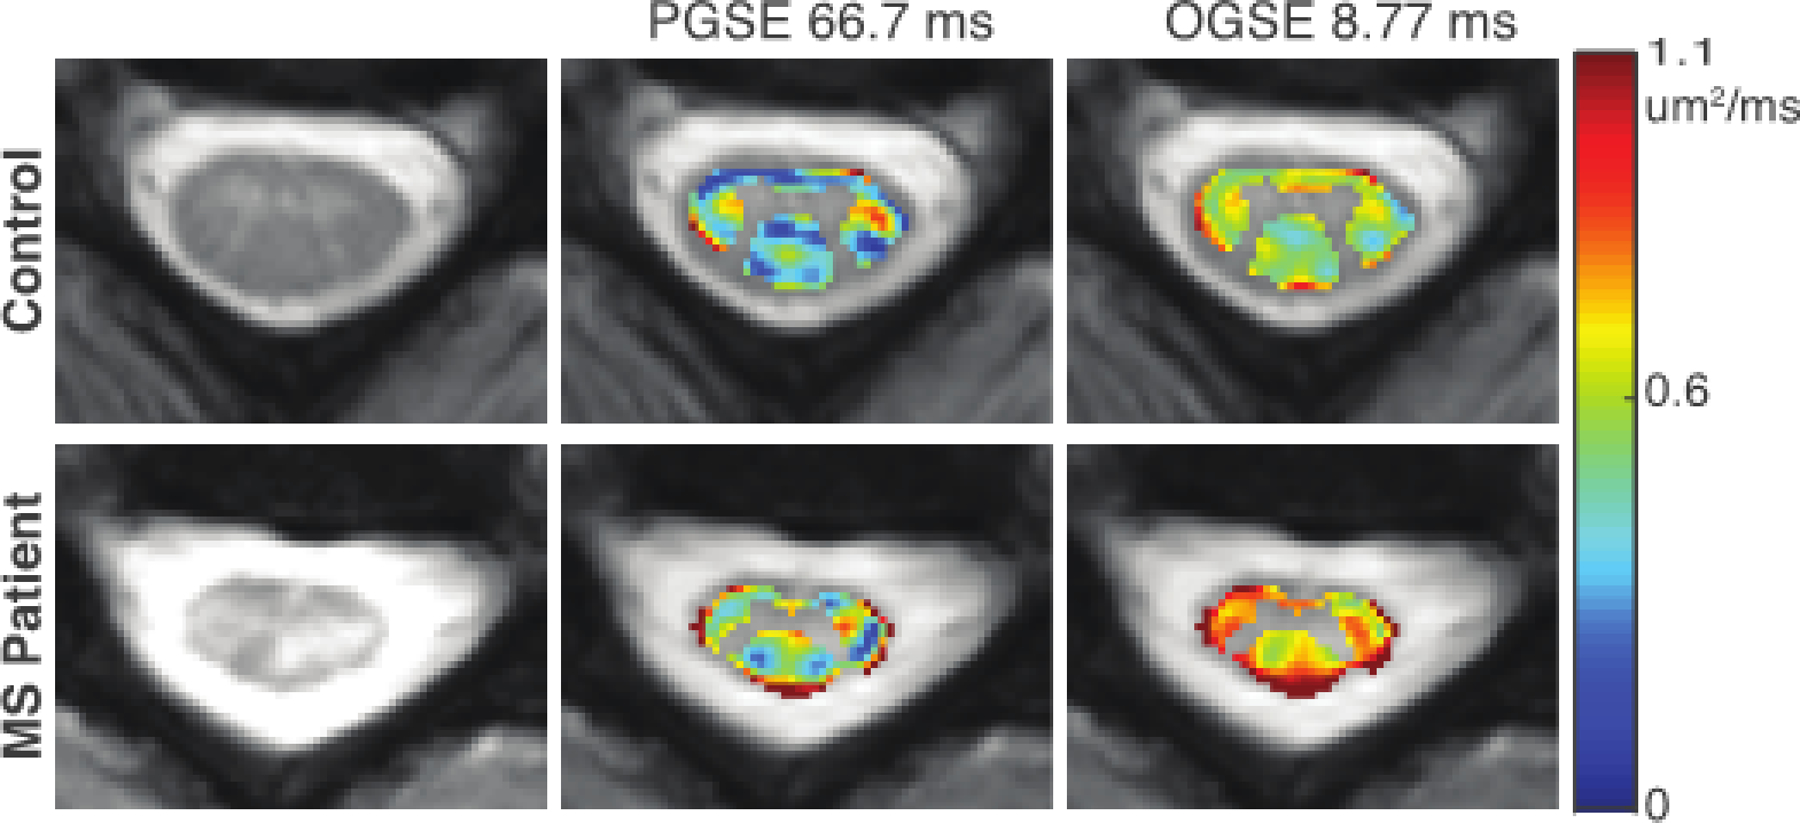
Comparison of RD maps in healthy control (top) and MS patient (bottom). From left to right, the anatomical image, RD map acquired with an effective diffusion time of 66.7 ms, and RD map acquired with an effective diffusion time of 8.77 ms are shown. A larger difference is observed between the healthy control and MS patient with the shorter diffusion times achievable with OGSE. The figure is reprinted with permission from (By et al., 2019).