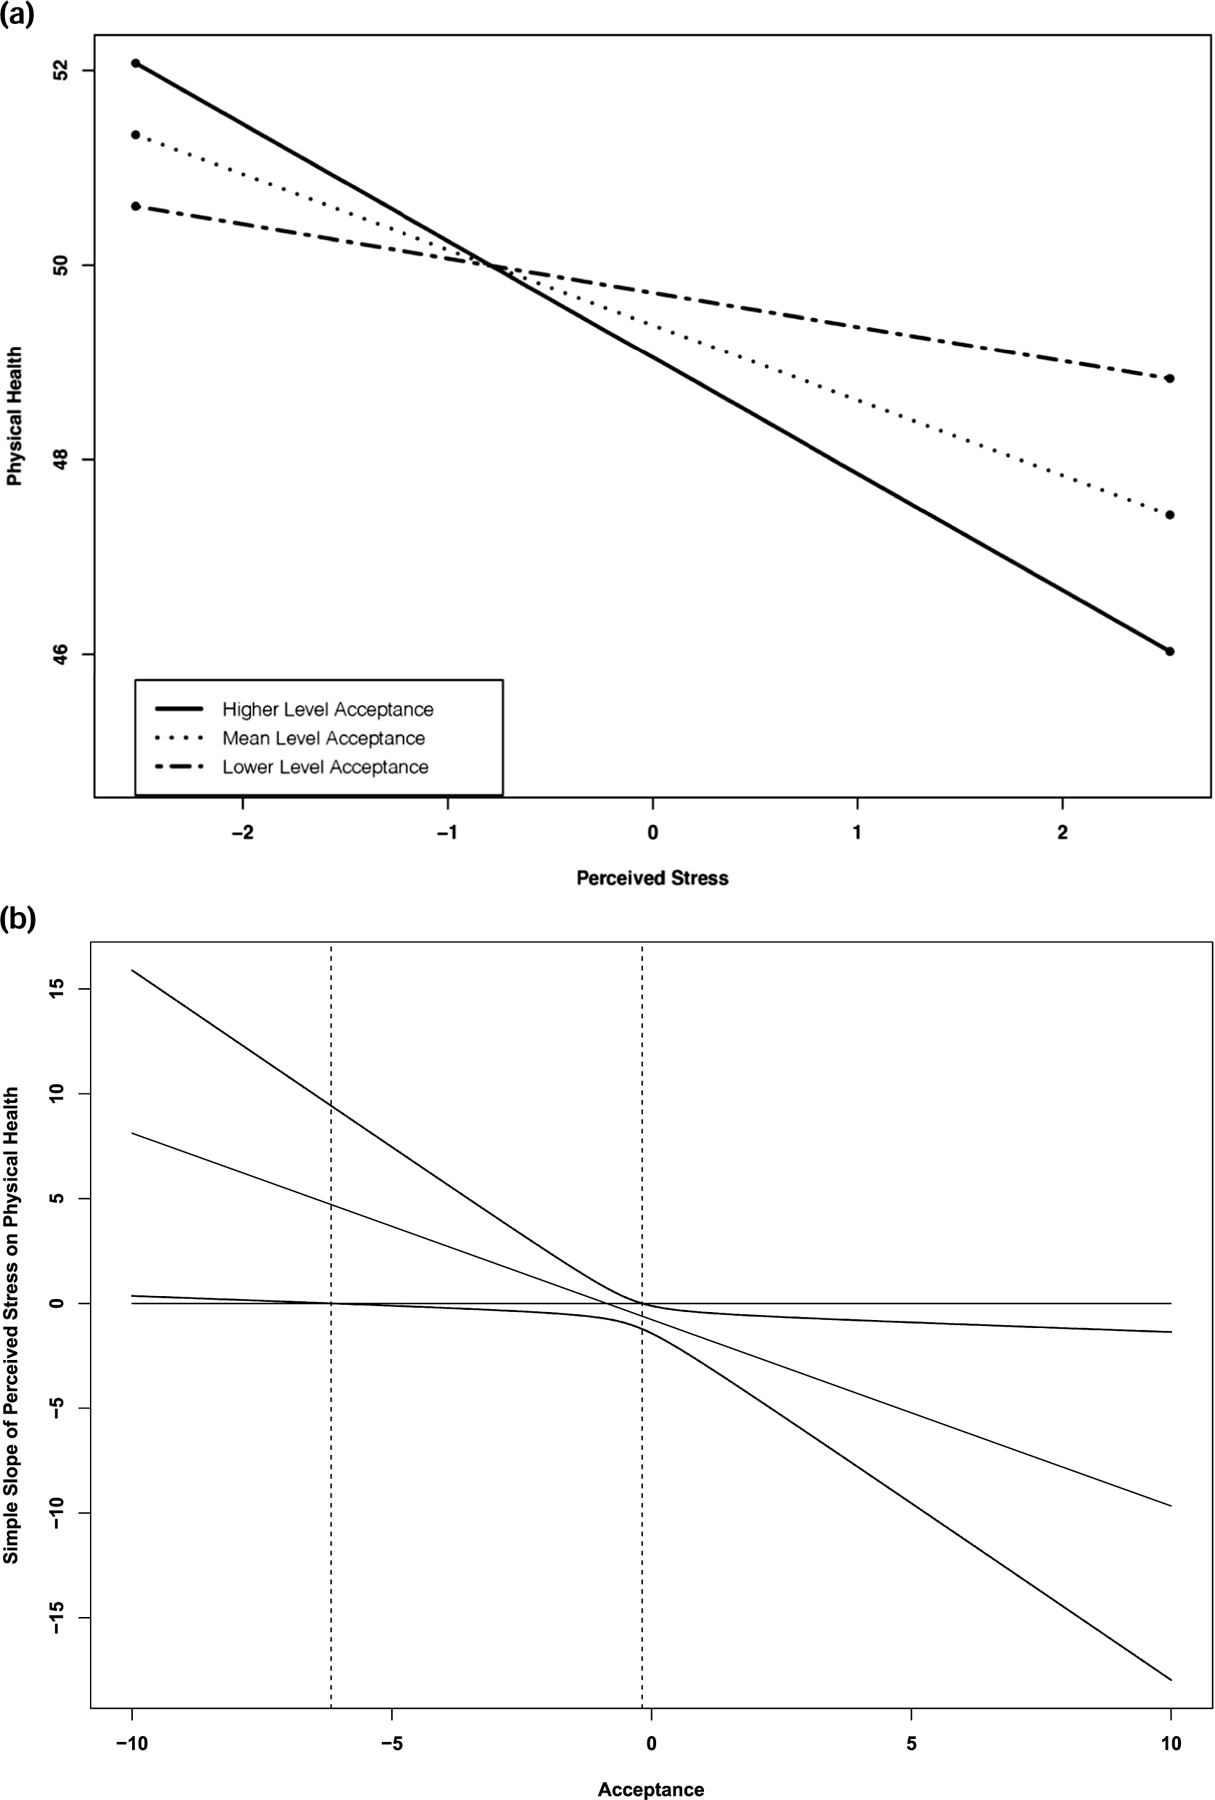
FIGURE 1.

(a) Concurrent relationship between perceived stress and global physical health (PCS) during the pandemic was moderated by acceptance coping. Higher values on the y-axis indicate better physical health. We decomposed data one standard deviation above, below the mean and mean, and tested simple slopes. (b) Johnson–Neyman plot of the simple slope of perceived stress on physical health at the average value (0) of perceived stress across the range of acceptance. Dotted lines represent the 95% of confidence interval
