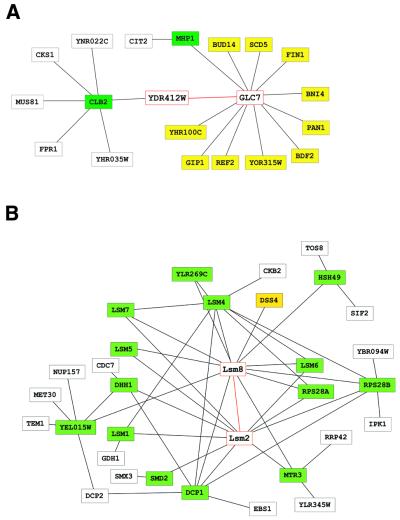
Figure 1.
Examples of protein–protein interaction networks. Nodes and lines denote proteins and interactions, respectively. The target proteins for calculation of the interaction generality and their interactions are shown in red. Green and yellow nodes are proteins associated with a given interaction; green nodes interact with more than one protein. According to the unimproved and improved definitions, the interaction generality is the number of yellow and green nodes + 1 and the number of yellow nodes + 1, respectively. Protein–protein interactions were obtained from Uetz et al. (14). Only proteins within two interaction steps of the protein pair are shown. The schema were drawn using the tool developed by Mrowka (32). (A) Protein–protein interaction network for proteins interacting with YDR412W or GLC7 or their interacting partners. Most of the proteins associated with GLC7 have distinct functions (24). BDF2, chromatin chromosome structure; BNI4, cell wall maintenance and cytokinensis; GIP1, meiosis; MHP1, mitosis; PAN1, cell polarity, cell structure and vesicular transport; REF2, RNA processing and modification; SCD5, vesicular transport. FIN1, YDR412W, YHR100C and BUD14 are uncharacterized proteins. (B) Protein–protein interaction network for proteins interacting with Lsm2 or Lsm8 or their interacting partners. The following interactions involving Lsm2 or Lsm8 were independently identified by Fromont-Racine et al. (33) and Pannone et al. (27): HSH49–LSM8, LSM1–LSM2, LSM2–LSM5, LSM2–LSM6, LSM2–LSM8, LSM2–SMD2, LSM4–LSM8, LSM5–LSM8, LSM6–LSM8, LSM8–MTR3 and LSM8–YEL015W.

