Figure 7.
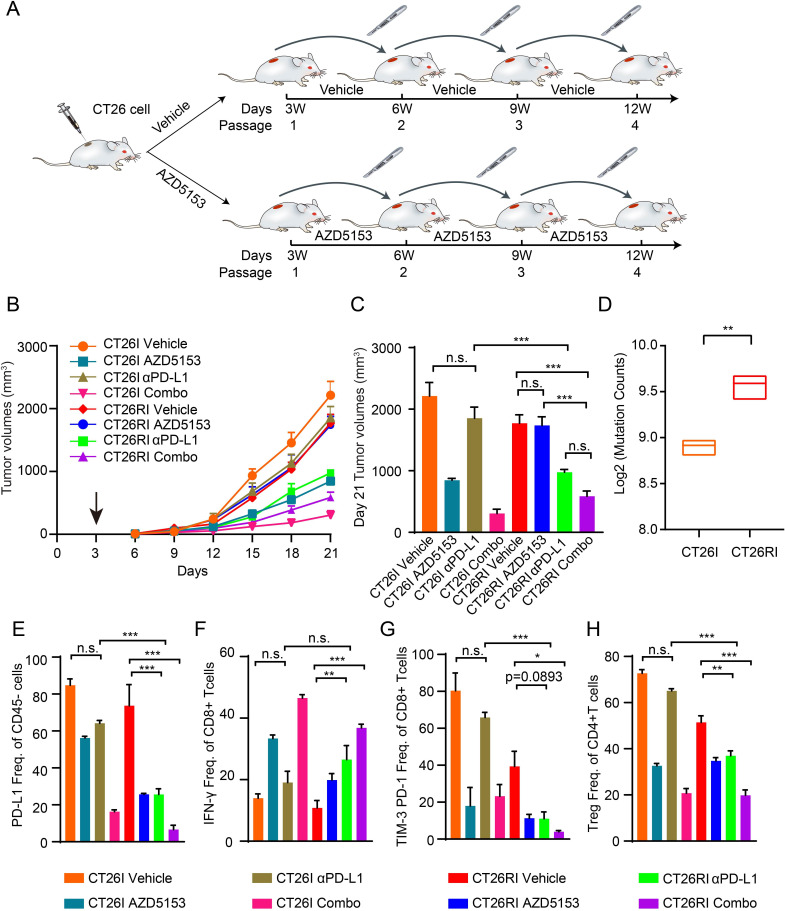
Prolonged exposure to BRD4i in vivo results in acquisition of dMMR, and BRD4i resistance and acquired sensitivity to αPD-L1 therapy (A) Scheme for the process of establishing of AZD515 resistant model in vivo (CT26RI) and the control model (CT26I). We first subcutaneously injected CT26 cells into BALB/c mice to establish the first-generation tumors. After 3 weeks of AZD5153 treatment, the remaining CT26 tumor tissues were transplanted into new BALB/c mice to construct the next generation tumors in vivo. Ultimately, a stable AZD5153-induced resistance in vivo model (CT26RI) and the control model (CT26I) were established after four rounds with or without continuous AZD5153 treatment until the growth of the CT26RI models was not suppressed by AZD5153 treatment. (B) We transplanted the tumor tissues with the same tumor sizes from the fourth generation of CT26I and CT26RI mice into 20 new BALB/c mice, respectively. Tumors of CT26I and CT26RI were further randomized into various treatment groups after implantation: Vehicle (n=5, 0.5% hydroxypropylmethylcellulose and 0.2% Tween 80), AZD5153 (n=5, 1.25 mg/kg per day, oral gavage), αPD-L1 antibody (n=5, 200 µg/mouse every 3 days for six times), or a combination of AZD5153 and αPD-L1 antibody (n=5). Average tumor volumes±SEM for each cohort is displayed. (C) Tumor volumes on day 21 of (B). Data represent mean±SEM. Analysis of variance (ANOVA) was used to compare differences among multiple groups: *, p<0.05; **, p<0.01; ***, p<0.001; n.s., not significant. (D) Tumor mutation counts derived from somatic variants by WES in CT26I and CT26RI tumors (n=3). (E–H) Quantification of PD-L1+ tumor cells (gated on CD45– cells) (E), effector CD8 T cells (CD8+ IFN-γ+, gated on CD8+ cells) (F), exhausted CD8 T cells (TIM-3+ PD-1+, gated on CD8+ cells) (G), and Treg cells (FOXP3+ CD25+, gated on CD4+ cells) (H) in CT26I and CT26RI tumors from each group, respectively (n=3) Data represent mean±SEM. P values were determined by ANOVA. *, p<0.05; **, p<0.01; ***, p<0.001. BRD4i, bromodomain containing 4 inhibitors; dMMR, deficiency mismatch repair; WES, Whole Exome Sequencing; IFN, interferon; TIM-3, T cell immunoglobulin and mucin domain 3; n.s., not significant; PD-1, programmed death; PD-L1, programmed death ligand 1; Treg, regulatory T cells.

