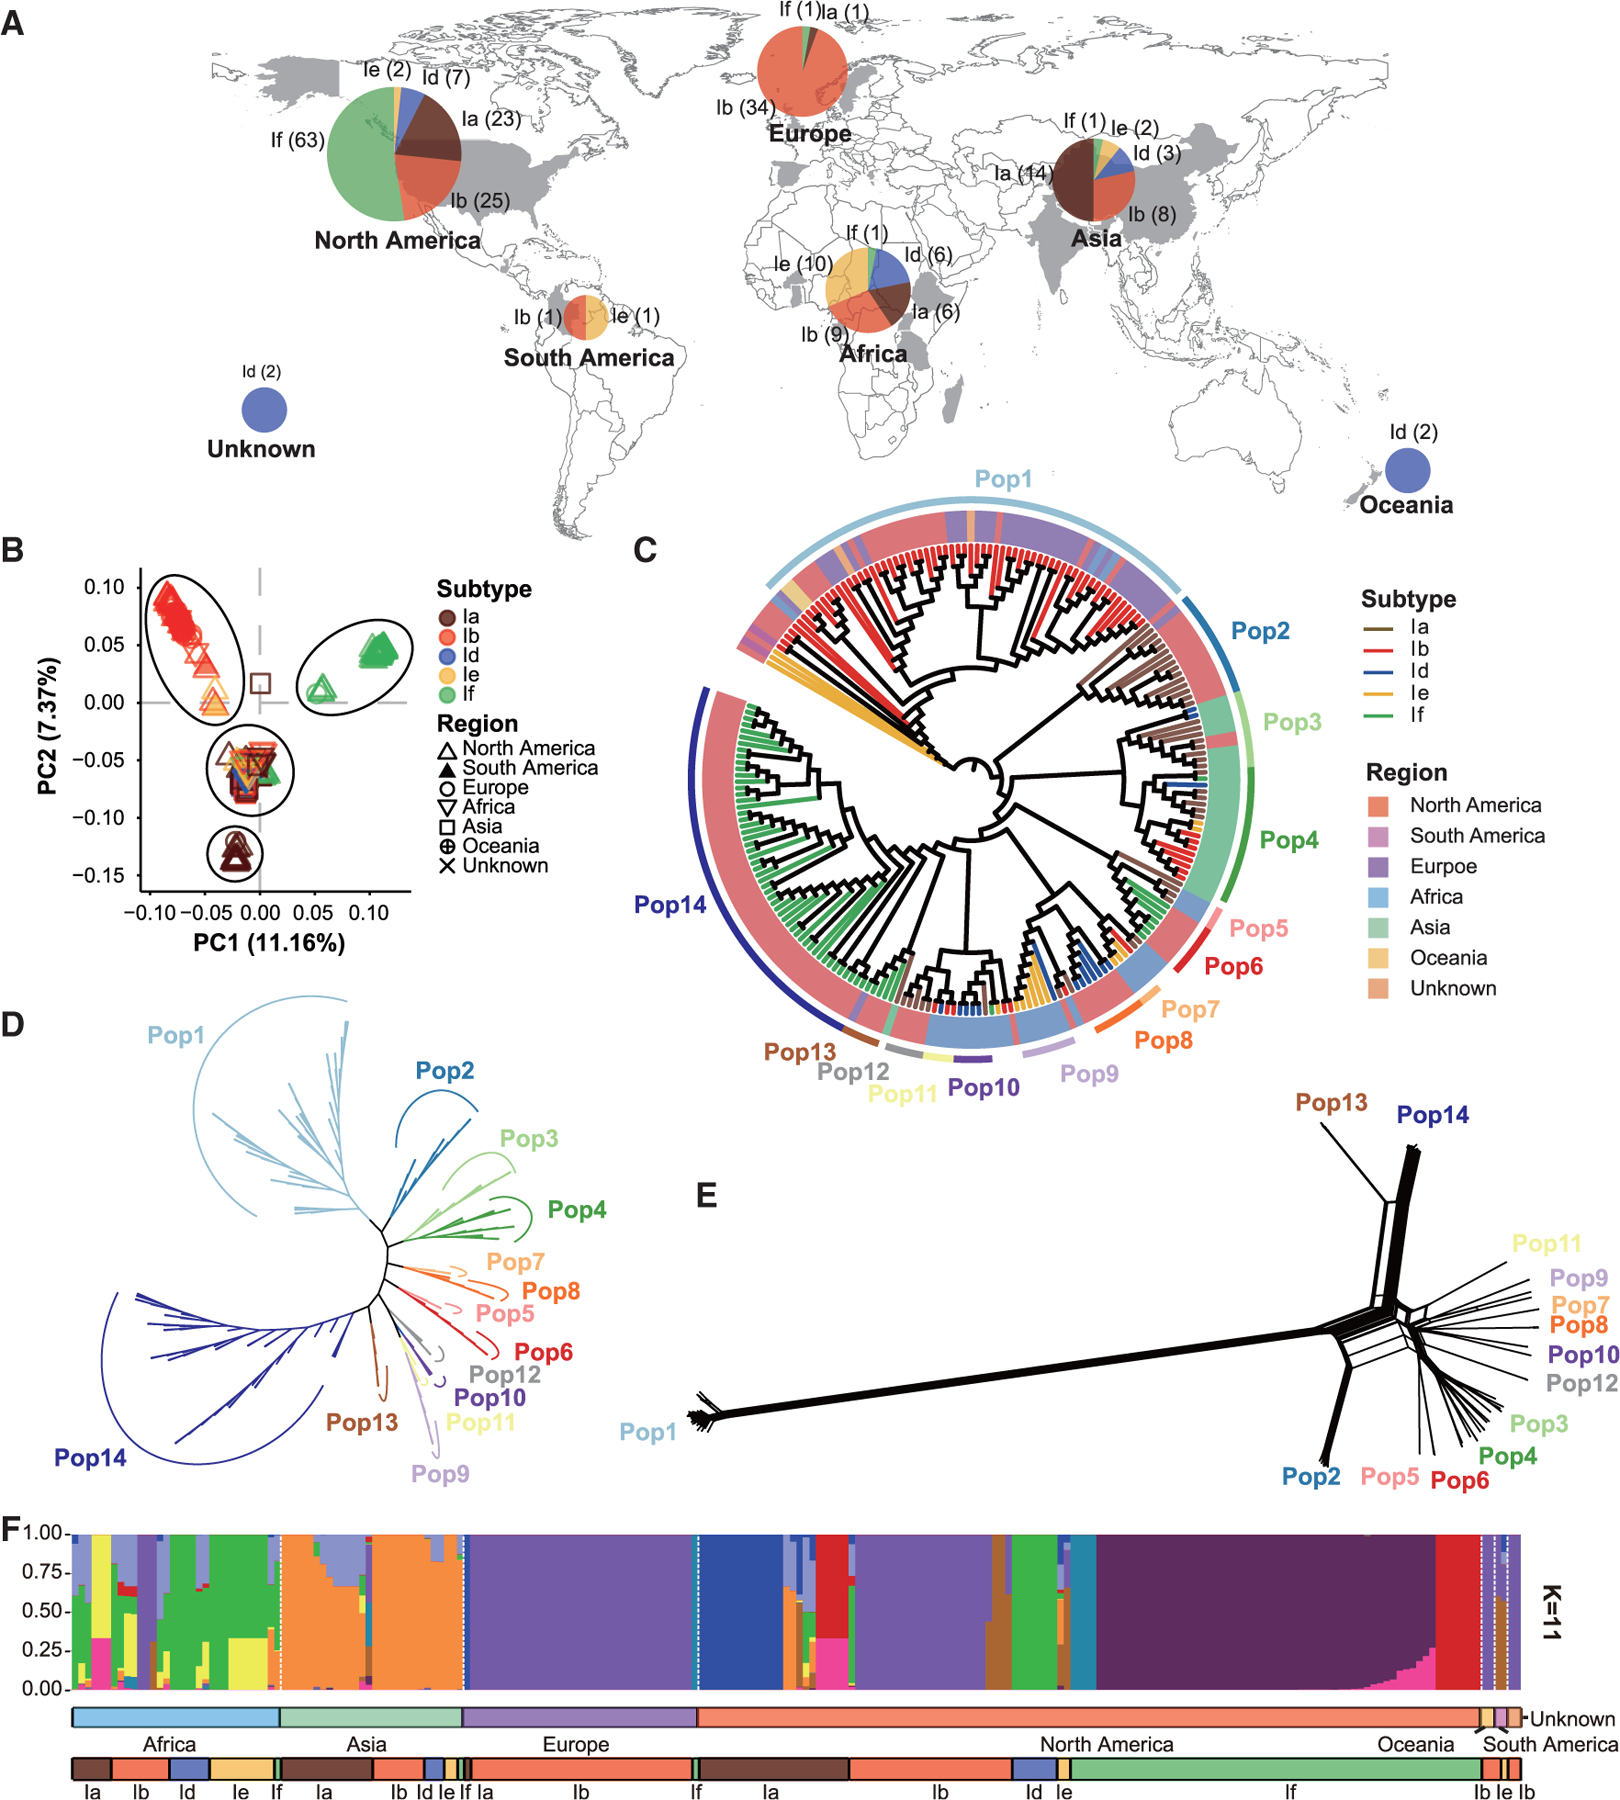
Figure 2. Population subdivision within Cryptosporidium hominis and the formation of three populations of IfA12G1R5.

Isolates are colored according to their subtype families (A–C and F), geographical origins (C), and populations (C–E). (A) Geographical origins of 222 samples used in this study. Subtypes Ia, Ib, Id, Ie, and If are represented in brown, red, blue, yellow, and green, respectively. (B) Principal-component analysis (PCA) of C. hominis isolates based on pruned SNPs, in which PC1 and PC2 account for variability among isolates. The colors of the symbols represent the C. hominis subtypes (colored the same as in A). The shapes show the sample sources. (C) Phylogenetic analysis inferred by maximum likelihood (ML) using 12,736 wgSNPs. The circular tree is shown ignoring the branch length, and the branch colors represent different subtypes (colored the same as in A). The background colors of the sample names represent the sample sources. These C. hominis isolates formed 14 clades. (D) Phylogenetic analysis of 9,394 wgSNPs among 199 isolates in the 14 populations. The unrooted ML tree was constructed using the transversion model and gamma distribution (TVM + G) implemented. The colors of the branches represent the populations (colored the same as in C). (E) A phylogenetic network of the 199 isolates based on 9,394 wgSNPs. The parallel edges in the network are suggestive of gene flows among isolates. (F) STRUCTURE plot representing the percentage of shared ancestry among the C. hominis metapopulation (for K = 11).
