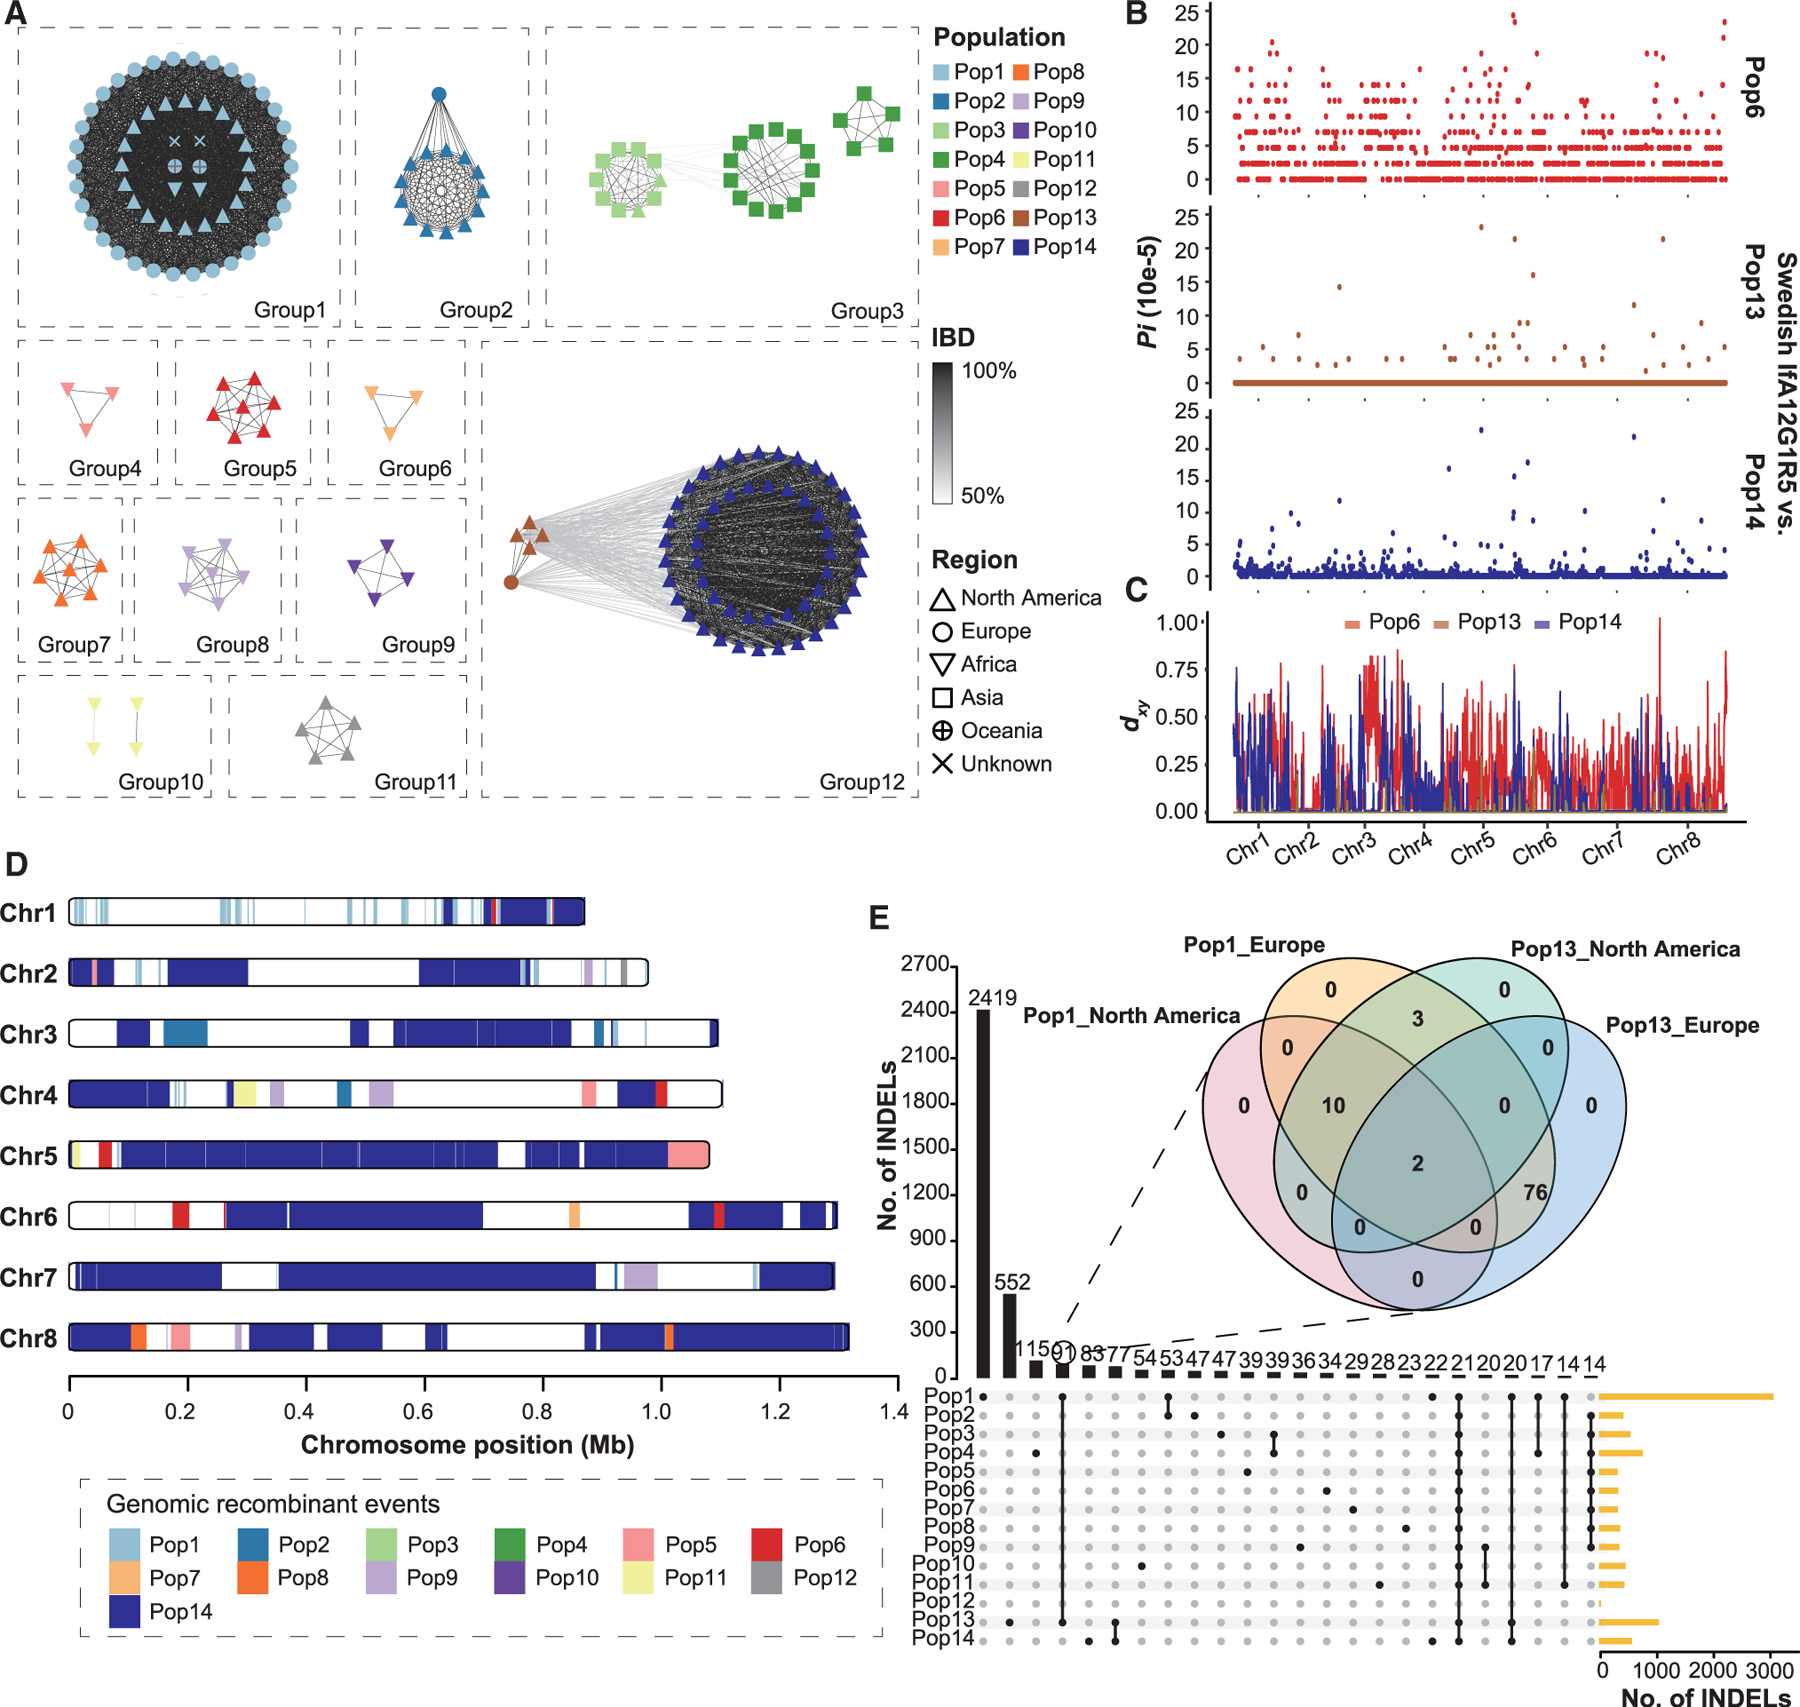
Figure 4. Origin of Pop13 (IfA12G1R5b).

(A) Relatedness network for pairs of isolates inferred using identity-by-descent (IBD) analysis. Nodes represent isolates, and their colors and shapes represent the populations and the geographic origins. Edges between two nodes indicate IBD sharing. All edges with IBD higher than the threshold (mean value + SD) are shown.
(B) Nucleotide diversity (Pi) between Swedish and US isolates of the IfA12G1R5 using a 10-kb window, showing genetic similarity of the Swedish IfA12G1R5 to Pop13.
(C) Absolute divergence (dxy) between the Swedish IfA12G1R5 isolate and the three IfA12G1R5 populations (Pop6, Pop13, and Pop14) across the eight chromosomes.
(D) Distribution of introgressed regions in the genomes of Pop13 based on the Fst value of 0 between Pop13 and the other populations across the eight chromosomes.
(E) Relationships of insertion and deletion (INDEL) sites among 14 populations. The venn diagram in the format of overlapping circles shows the relationships among Pop1 and Pop13 isolates from both North America and Europe, whereas Upset plot shows the relationships of INDELs among the 14 populations.
