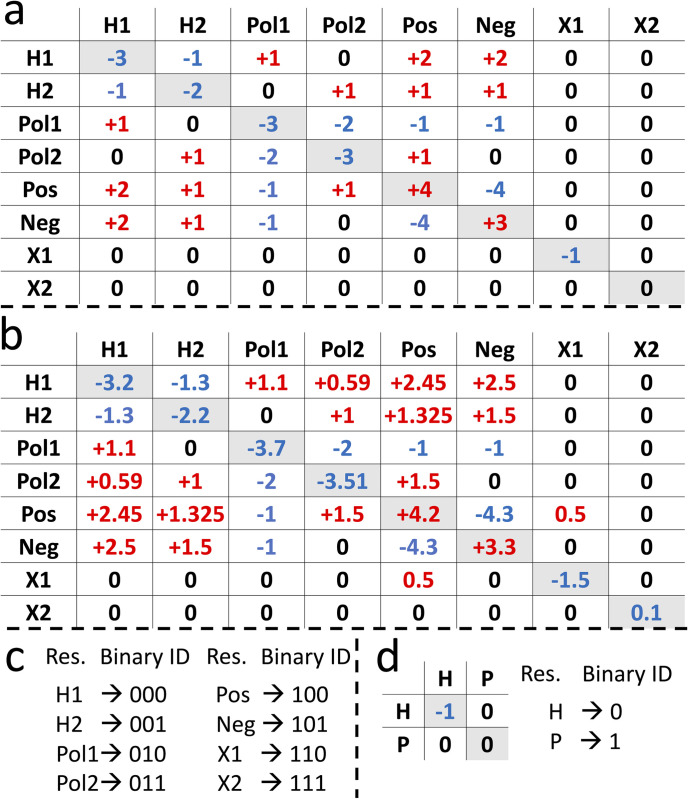
Fig 3. Energy tables to represent the pair-wise interactions in our systems and the binary representation of residues.
Energy tables for: a) The SP model; b) The MR model. c) Binary representation of residues in the energy table. d) Energy table and the residue representations for the HP protein model. In a–c) H1 and H2 represent two types of hydrophobic residues, Pol1 and Pol2 represent two types of polar residues, Pos represents a positive residue, Neg represents a negative residue, and two types of “other” residues that do not fit in any of the previous categories are represented by X1 and X2. Note that all energies in our tables have qualitative values. In d) H represents hydrophobic and P represents polar residues.

