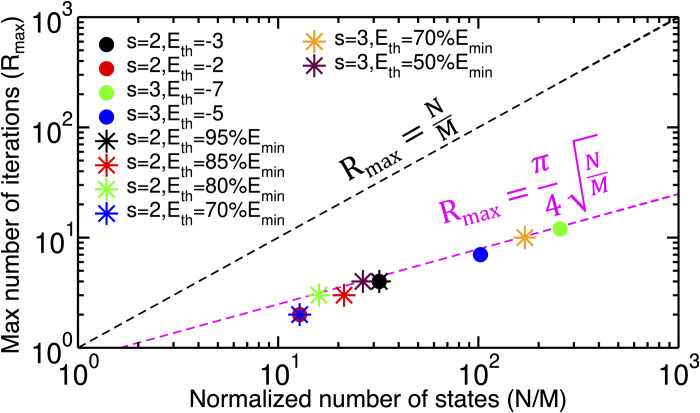
Fig 6. The maximum number of iterations (Rmax) values as a function of normalized number of states (N/M).
The circles represent the data for the SP model and the stars are the data for the MR model. The magenta dashed line shows the Rmax threshold for Grover’s algorithm, while the black dashed line is the threshold of the classic realm.

